
A molecular diagnostics lab in Atlanta found this out the hard way last year. Their PCR instruments were generating solid quality control data. Technicians documented every run. And yet FDA auditors flagged 47 reporting inconsistencies during their inspection. Not because the data was wrong—because different reports showed the same QC metrics in different formats, different decimal places, different terminology.
The problem wasn't quality control. It was the gap between raw instrument outputs and audit-ready documentation.
The Hidden Complexity of QC Data Flow
Most labs treat automated QC reporting like a simple data transfer problem. Connect instruments, pull numbers, generate PDFs. Regulatory bodies don't see it that way. They care about traceability, consistency, validation checkpoints, and the ability to reconstruct exactly how any number in any report came from raw instrument data.
A typical qPCR run generates around 200 data points across amplification curves, threshold cycles, and standard curves. By the time that becomes a validated QC report, those 200 points need to transform into roughly 15 standardized metrics, pass through 8 to 12 validation rules, trigger appropriate flags, and maintain a complete audit trail. Every transformation point is a potential failure mode during inspections.
The real challenge isn't capturing data or creating reports. It's building a pipeline that maintains data integrity while transforming raw instrument outputs into templated, validated documents that satisfy both internal SOPs and external regulatory requirements.
Where QC Data Pipelines Actually Break
After watching dozens of labs struggle with automated QC reporting systems, three failure patterns come up consistently.
Eliminate lab bottlenecks and errors.
Labioly helps you monitor, manage, and report lab activities efficiently and compliantly.
- Real-time sample tracking
- Inventory and supply alerts
- Staff workflow coordination
No credit card required
Format chaos at the source
Different instruments export data differently. Your thermocycler outputs CSV files with cycle data in columns. Your spectrophotometer generates XML with nested quality metrics. Your plate reader produces tab-delimited text with metadata buried in headers. Each format requires custom parsing logic, and labs typically discover edge cases only after reports fail validation.
One clinical lab running 12 different instrument types found their parsing scripts broke whenever technicians used apostrophes in sample names. Another discovered their European-manufactured analyzer used commas as decimal separators, so their pipeline was reading "2,5" as two separate values instead of 2.5.
Validation logic scattered everywhere
Labs often implement validation rules at multiple points—some in the data capture layer, some during transformation, some in report templates. That scattered approach creates maintenance nightmares and makes it nearly impossible to track why specific data points got flagged or modified.
A genomics facility in Boston had validation rules in three separate places: Python scripts checking raw data, Excel macros validating intermediate files, and Word templates with embedded formulas for final calculations. When auditors asked how they validated Ct values above 35, the team spent four hours tracing through code trying to explain the logic.
Template rigidity versus operational reality
Standard QC report templates assume perfect data flows. Real lab operations don't. Partial runs, repeated samples, control failures that need documentation but not necessarily rejection—these scenarios break rigid templates constantly.
Building Admissibility Checkpoints That Actually Work
Regulatory admissibility isn't about having perfect data. It's about demonstrating control over your data pipeline. That means implementing checkpoints that verify both data integrity and process compliance at each transformation stage.
Stage 1: Instrument Data Capture
-
File timestamp within expected run window
-
All required data fields present
-
Numeric values within instrument specifications
-
No duplicate run identifiers
-
Metadata consistency (operator, protocol, date)
Stage 2: Data Transformation and Calculation
As raw data transforms into reportable metrics, each calculation needs explicit validation. Not just checking math—ensuring transformations follow documented SOPs and that any data modifications leave clear audit trails.
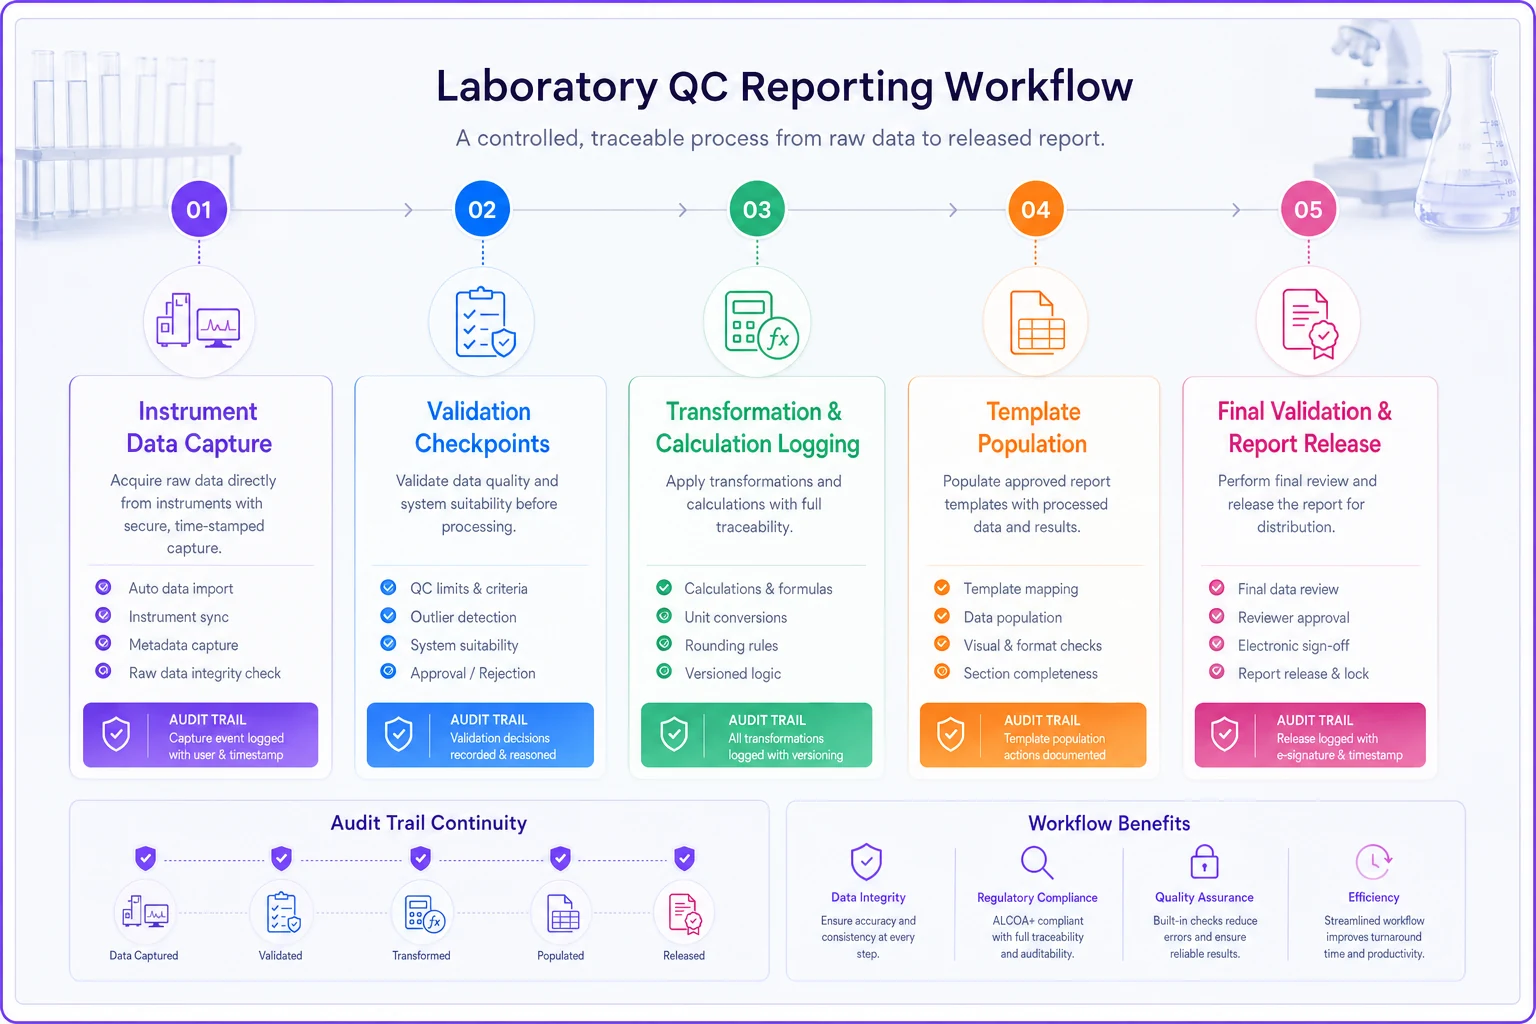
The graphic above shows the checkpoints and audit markers at each transformation step.
A reference lab processing 400+ samples daily implemented transformation tracking that logs every calculation step. When regulators questioned how they calculated percent recovery values, they could show the exact formula applied, the specific raw values used, and any rounding or adjustment rules.
Stage 3: Template Population
Populating report templates requires more than inserting values into fields. Each data point needs context—which instrument generated it, when it was captured, what validation it passed, and whether any flags or exceptions apply.
Stage 4: Final Validation
Before any report gets released, run comprehensive validation comparing final values against source data, checking internal consistency, and verifying that all required sections contain appropriate content.
Report Templates That Scale Beyond Basic Requirements
Generic QC report templates fail because they assume standard operations. Real labs need templates that handle edge cases while maintaining regulatory compliance.
PCR Amplification Quality Control Report Template
| Section | Items |
|---|---|
| HEADER SECTION | - Report ID: [Auto-generated, sequential] - Generation Date/Time: [System timestamp] - Instrument ID: [From instrument data] - Run ID: [From instrument data] - Operator: [From instrument data or system login] - Protocol: [From run parameters] |
| SAMPLE INFORMATION | - Sample Type: [Patient/Control/Standard] - Sample ID: [From worklist] - Replicate Number: [If applicable] - Dilution Factor: [If applicable] |
| RAW DATA METRICS | - Baseline Start/End Cycles - Threshold Setting - R² Value for Standard Curve - Efficiency Percentage - Slope and Intercept |
| CALCULATED RESULTS | - Ct/Cq Values (all targets) - Quantity (if quantitative assay) - Positive/Negative/Invalid Call - Internal Control Status |
| QUALITY INDICATORS | - NTC Status: [Pass/Fail with Ct if detected] - Positive Control: [Ct range check] - Efficiency: [Acceptable range 90-110%] - R² Value: [Minimum 0.98] - Replicate CV: [Maximum 2%] |
| FLAGS AND EXCEPTIONS | - Automatic Flags: [List any triggered] - Manual Overrides: [With justification] - Corrective Actions: [If applicable] |
| VALIDATION TRAIL | - Data Capture: [Timestamp and checksum] - Transformation Applied: [List of calculations] - Template Version: [For traceability] - Review Status: [Pending/Approved/Rejected] |
This structure handles standard runs while accommodating common variations. Failed controls get documented without invalidating entire reports. Repeated samples show clear linkage. Manual interventions require justification fields.
Implementing Dynamic Template Logic
Static templates break when faced with operational variations. Dynamic templates adjust based on data characteristics while maintaining compliance requirements.
When control samples fail, for example, the template should automatically flag the failure prominently, include additional fields for root cause documentation, adjust result interpretation sections, and require supervisor review attestation.
A toxicology lab processing both qualitative drug screens and quantitative confirmations uses conditional template sections. Qualitative results show presence/absence with cutoff values. Quantitative results display concentrations with uncertainty measurements. The same base template handles both by activating different sections based on assay type metadata.
Verification Tests That Catch Issues Before Auditors Do
Most labs test their automated QC reporting by checking if reports generate successfully. That's like testing a car by confirming the engine starts. Real verification requires testing across multiple scenarios.
Data Integrity Verification
Boundary condition tests: Use values at the extreme edges of acceptable ranges. If Ct values above 40 are invalid, test with 39.9, 40.0, and 40.1. This reveals whether your pipeline handles boundaries consistently.
Malformed data tests: Intentionally corrupt test files in ways that might occur naturally—missing columns, extra rows, special characters, inconsistent delimiters. Your pipeline should either handle these gracefully or fail with clear error messages.
Volume stress tests: Process datasets 10x larger than normal to identify performance bottlenecks or memory issues that might cause silent data loss.
Compliance Verification
Audit trail completeness: Select random historical reports and attempt to reconstruct them from source data. Every calculation should be reproducible, every transformation documented.
Change control verification: Modify a validation rule or template element, then verify that the system properly versions changes and keeps access to previous versions for historical reports.
Access control testing: Verify that only authorized users can modify templates, override validations, or approve reports—and that the system logs all such actions.
Operational Scenario Testing
-
Instruments going offline mid-run
-
Partial data files from interrupted runs
-
Duplicate sample IDs across different runs
-
Time zone differences between instruments and reporting systems
-
Network interruptions during data transfer
-
Database locks during concurrent report generation
A genetics testing facility discovered their pipeline was silently dropping samples when two instruments uploaded data simultaneously. They only caught it because they'd implemented weekly verification comparing report sample counts against LIMS records.
Maintaining Pipeline Reliability Over Time
The best QC reporting pipeline becomes worthless if it degrades over time. Instruments get firmware updates that subtly change output formats. New assays require additional validation rules. Regulatory requirements shift.
-
Daily report generation success rates
-
Average time from run completion to report availability
-
Frequency of manual interventions required
-
Number of validation rule triggers by type
Log template version IDs in the report header to simplify auditors' reconstruction of historical reports.
When success rates drop below 95% or processing time increases beyond your baseline, investigate immediately. These metrics often surface issues before they cause failed audits.
Document every pipeline modification in a change control log—what changed, why, who approved it, and what testing verified the change. That documentation becomes critical during inspections when auditors ask about historical reports generated under previous pipeline versions.
The Operational Reality of Automated QC Reporting
Perfect automated QC reporting doesn't exist because perfect lab operations don't exist. Instruments malfunction, technicians make mistakes, samples get mislabeled, and controls occasionally fail for legitimate reasons. Your pipeline needs to handle these realities while maintaining the documentation trail that proves you're in control.
The most successful implementations focus on transparency over perfection. When something goes wrong, the pipeline should clearly document what happened, what checks caught it, and what actions were taken. Auditors prefer systems that acknowledge and handle problems over those that pretend problems don't exist.
AI-powered operational software can meaningfully reduce the manual effort required to maintain these pipelines. Automation helps identify patterns in validation failures, suggests template adjustments based on historical issues, and monitors for drift in instrument outputs. But the core challenge is still fundamentally operational—designing data flows that balance regulatory requirements with laboratory reality.
Start with a minimal pipeline that handles your most common scenarios well. Add complexity only when needed, always maintaining the ability to trace any report back to its source data. Test thoroughly, document everything, and keep in mind that automated QC reporting succeeds not when it eliminates human oversight, but when it makes that oversight more effective and consistent.
The goal isn't to automate away quality control responsibilities. It's to build systems that make demonstrating quality control straightforward, repeatable, and audit-ready from day one.
Ready to upgrade your lab operations?
Join 500+ labs using Labioly to save time, reduce errors, and enhance productivity and compliance.