
Four months ago, I watched a research lab lose three weeks of experimental data because their mass spectrometer's CSV export started adding an extra comma in compound names containing parentheses. Their data pipeline had been running smoothly for eighteen months—ingesting files, parsing results, updating their LIMS. Nobody noticed the parsing errors buried in log files until a PhD student couldn't find half their samples in the database.
The integration vendor had marked the connector as "fully tested and production-ready."
After building data capture systems for labs ranging from small biotech startups to major pharmaceutical research facilities, I've cataloged the connector patterns that actually survive contact with real instrument outputs. Not the clean, theoretical approaches you see in integration guides, but the messy reality of dealing with instruments that were designed when floppy disks were cutting-edge technology.
Why instrument integrations fail in predictable ways
Most lab instrument integration failures follow a depressingly predictable pattern. The integration works perfectly during setup—test files parse correctly, data flows into the right fields, everyone's happy. Then six months later, you discover that every sample processed on Tuesdays has been silently dropped because the instrument technician changed a decimal separator setting during routine maintenance.
These failures happen because instrument manufacturers treat data export as an afterthought. The Agilent HPLC that costs $85,000? Its CSV export module was probably written by an intern in 2003 and hasn't been touched since. That Waters UPLC system? It outputs files in a format that changes subtly based on which method template you started from.
The real problem isn't technical complexity—it's that every instrument has its own special flavor of broken. A Thermo Fisher mass spec might randomly insert Unicode characters in sample names. A PerkinElmer plate reader could decide to swap row and column headers based on plate type. A Beckman Coulter analyzer might output timestamps in local time during summer but UTC during winter because someone hardcoded a timezone conversion.
Traditional integration approaches assume instruments behave consistently. They don't. Once you accept that instrument data export is fundamentally unreliable, you can build systems that actually work.
The three connector patterns that handle 90% of real lab scenarios
Pattern 1: The Defensive CSV Watchfolder
Eliminate lab bottlenecks and errors.
Labioly helps you monitor, manage, and report lab activities efficiently and compliantly.
- Real-time sample tracking
- Inventory and supply alerts
- Staff workflow coordination
No credit card required
The watchfolder pattern seems simple—monitor a directory, grab new files, parse them, move on. But a production-ready watchfolder for lab instruments needs defensive programming at every step.
A realistic implementation for a typical HPLC outputting CSVs requires several safeguards.
First, you never trust the file to be complete when it appears. Instruments often start writing files before they're done processing. Set up a stability check—only process files that haven't changed size for at least 30 seconds. Partial chromatograms imported because someone grabbed the file while the instrument was still writing peaks are more common than you'd think.
Second, implement character encoding detection, not assumption. That German lab running an older Shimadzu GC? It's outputting Windows-1252 encoded files with special characters in chemical names. The Singapore facility with the exact same model? UTF-8. Auto-detect encoding or you'll lose any sample with an umlaut or degree symbol.
Third, build your parser to handle structural variations within the same instrument. A real example from a Waters Acquity UPLC:
-
Normal run
15 header rows, then data
-
Calibration run
18 header rows, then data
-
Failed run
12 header rows, error message, partial data
-
System suitability test
Different column order entirely
Your parser needs to identify the run type from header content, not line counts. Look for marker phrases like "Calibration Report" or "System Suitability" to determine the structure, then apply the appropriate parsing logic.
Pattern 2: The Stateful API Wrapper
Modern instruments increasingly offer APIs, but they're rarely RESTful or well-designed. They're usually SOAP interfaces from 2008 or custom TCP protocols that assume you're running their proprietary software.
The key to reliable API integration is maintaining state outside the instrument's API. Never trust the instrument to track what you've already retrieved.
Build a local state table that tracks:
-
Last successful poll timestamp
-
Last processed sample ID
-
Running hash of retrieved data
-
Number of sequential failures
When polling a Tecan liquid handler API, you might structure requests like:
-
Request samples since (lastpolltimestamp - 5 minutes)
-
Compare returned IDs against your processed_samples table
-
Only process genuinely new entries
-
Update state table after successful processing
-
If you get the same data three polls in a row, increment the timestamp
This overlap approach catches samples that appear with slight delays—common when instruments buffer results during high throughput runs.
For connection resilience, implement exponential backoff with a twist: after three failed connections, try a full reconnection sequence including re-authentication. Many instrument APIs have session bugs where tokens expire but still return success codes.
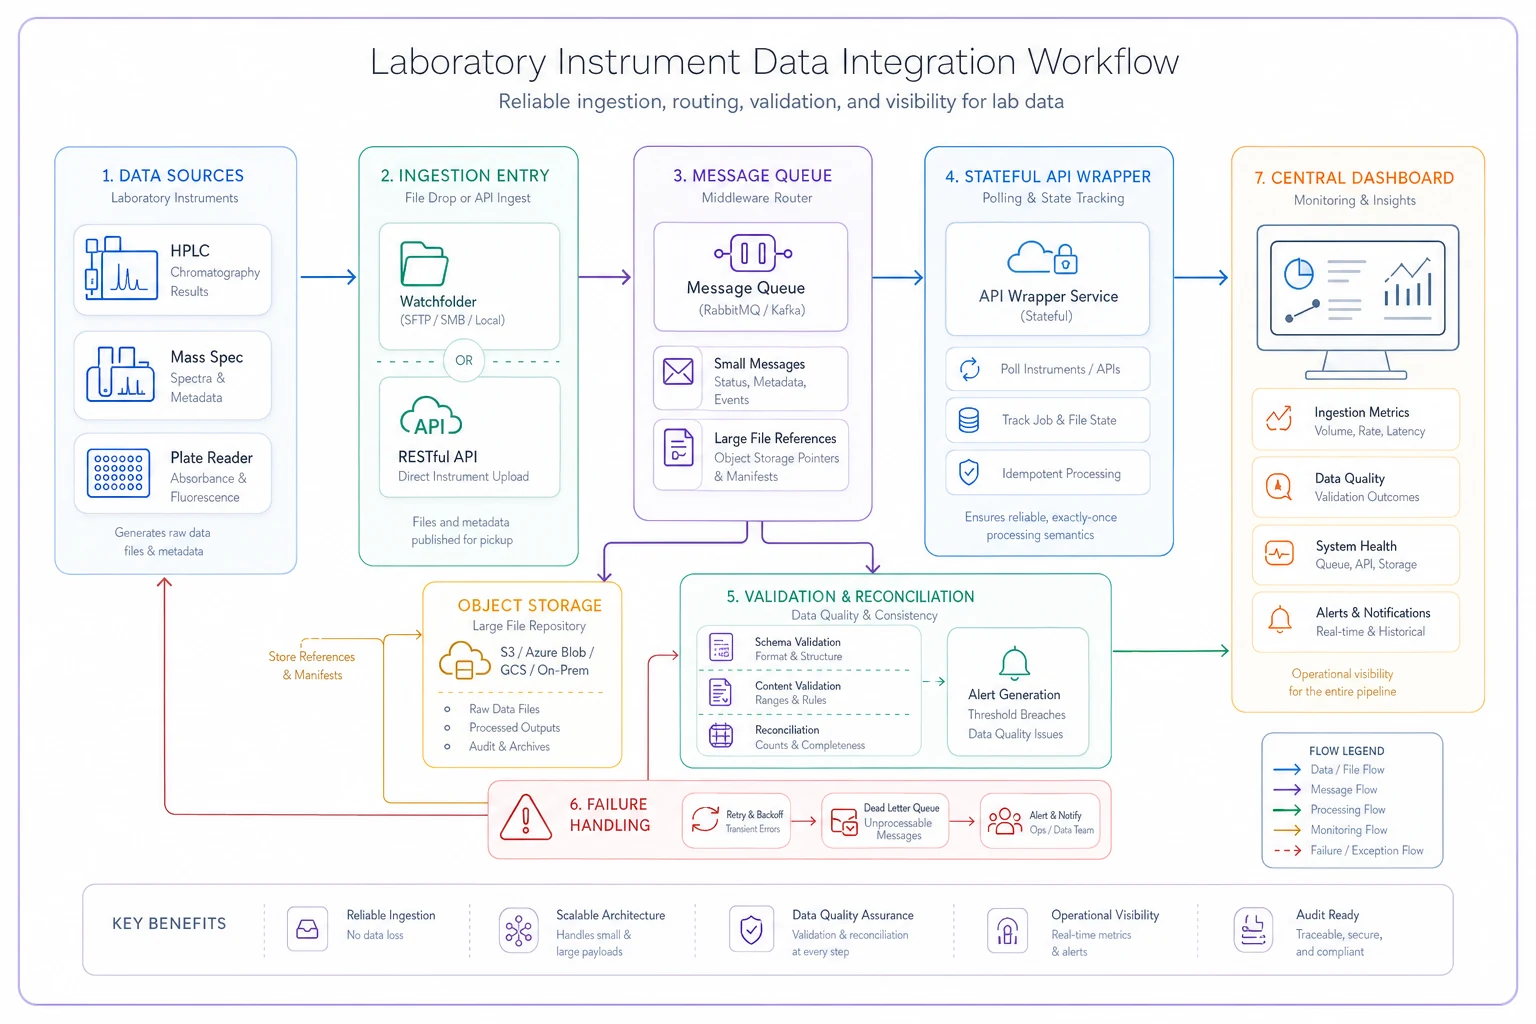
Pattern 3: The Middleware Message Queue
For complex labs with multiple instruments, direct integration becomes unwieldy. Instead, use a message queue pattern where each instrument publishes to a central broker.
But labs differ from typical IT infrastructure in one crucial way: your message queue needs to handle massive payload disparities. A pH meter might send 50 bytes every reading. A next-gen sequencer could dump 10GB files.
Structure your middleware to handle both types effectively. Small, frequent messages go direct to queue. Large files get uploaded to object storage with queue containing just the reference. Mixed payloads get automatic routing based on size threshold.
Set your threshold around 1MB. Below that, embed the data directly in the message. Above it, upload to S3 or local NAS and include just the reference.
The middleware approach scales better than dozens of point-to-point connectors and centralizes failure handling where operational teams can see it.
Real data models that survive production
Generic data models break immediately when faced with actual instrument output. You need schemas that expect inconsistency.
A battle-tested model for chromatography data looks like this:
| Table | Key Fields | Purpose |
|---|---|---|
| Core Measurement | measurementid, instrumentid, timestamprecorded, timestampprocessed | Main data container |
| Peak Data | peakid, retentiontime, area, height, compound_name | Individual peak results |
| Audit Trail | parserversion, validationstatus, validation_errors | Quality tracking |
Critical design decisions:
Store both the instrument's compound name and your internal ID. Instruments often report "Caffeine" vs "caffeine" vs "CAFFEINE" for the same compound. Map to your reference data but preserve the original.
Keep gradient_profile as JSON. Every HPLC vendor has a different gradient format. Trying to normalize this into relational tables creates more problems than it solves.
Always separate timestamprecorded from timestampprocessed. The difference reveals instrument clock drift, which affects everything from sample tracking to regulatory compliance.
Verification steps that catch issues before they cascade
Raw data ingestion is only step one. Without verification, you're just moving garbage from files to database.
Level 1: Structural Validation
Before parsing any values, verify the file structure matches expected patterns. Column count consistent across rows? Required headers present? Data types match expectations? File size within reasonable bounds?
-
File has between 100 and 100,000 rows (catches corrupted/truncated files)
-
Headers include "Retention Time" and "Base Peak Intensity"
-
At least 90% of rows have numeric values in numeric columns
This catches obvious problems before they become data quality nightmares.
Level 2: Boundary Checking
Every instrument has physical limits. Use them:
-
HPLC retention time
0 to method_duration
-
UV absorbance
-0.5 to 4.0 AU (instrument maximum)
-
Mass accuracy
within ±10 ppm of theoretical
-
Temperature
-80°C to 200°C (depending on instrument)
Values outside these ranges indicate parsing errors or instrument problems.
Level 3: Cross-Sample Validation
Compare new data against historical patterns. Internal standard retention times should be consistent (±0.1 min). Blank samples shouldn't have major peaks. Control samples should match historical averages (±15%).
When validation fails, don't just log it. Create actionable alerts: "Warning: Caffeine retention time 5.2 min (expected 4.8-5.0 min). Possible column degradation or mobile phase issue. Last calibration: 3 days ago."
The instrument-specific pitfall library you actually need
Agilent 1260/1290 HPLC Series
Pitfall: ChemStation exports add extra columns when custom calculations are enabled, shifting all subsequent data.
Fix: Parse headers dynamically, never assume column positions. Map by column name, not index.
Pitfall: OpenLab CDS randomly outputs exponential notation for very small peaks (like "1.23E-05") while using standard notation elsewhere.
Fix: Use a numeric parser that handles both formats. Python's float() works; Java's parseInt() doesn't.
Waters ACQUITY UPLC
Pitfall: Empower software exports different decimal separators based on Windows regional settings.
Fix: Detect separator from header row (look for "1.5" vs "1,5" in flow rate), then apply consistently.
Pitfall: MassLynx can export the same data in three formats (narrow, wide, or comprehensive) depending on user preference.
Fix: Identify format from header count—narrow has ~8 columns, wide has ~15, comprehensive has 30+.
Thermo Scientific Orbitrap
Pitfall: RAW files contain multiple scans per retention time. Direct conversion to CSV can duplicate or average these incorrectly.
Fix: Use vendor libraries (like ThermoRawFileParser) that handle scan averaging properly. Never try to parse RAW files directly.
Pitfall: Compound names in Tracefinder exports can contain tabs and newlines, breaking TSV parsing.
Fix: Pre-process with regex to replace \t and \n in quoted fields before parsing.
PerkinElmer Plate Readers
Pitfall: EnVision software exports plate layouts that change orientation (row-major vs column-major) based on detection mode.
Fix: Check if A1 follows A2 or B1 to detect orientation, then transform accordingly.
Pitfall: Some exports include temperature and timestamp in header, others in footer, some in both.
Fix: Scan first 20 and last 20 lines for metadata before processing plate data.
Beckman Coulter
Pitfall: Biomek liquid handlers can export the same plate multiple times if a run is paused and resumed.
Fix: Track plate barcode + timestamp combinations. If you see a duplicate, compare data—if identical, skip; if different, flag for manual review.
These aren't edge cases. These are the predictable ways instruments break that will cost you weeks of troubleshooting if you don't plan for them.
Building reconciliation that actually catches discrepancies
Reconciliation isn't just counting records. It's verifying that your captured data accurately represents what happened in the lab.
Start with record counts, but make them meaningful:
-
Expected samples from LIMS
96
-
Files found in watchfolder
94
-
Successfully parsed records
93
-
Records passing validation
91
This cascade immediately shows where losses occurred. Next, implement checksum validation at multiple levels. File-level uses MD5 of raw file. Parse-level hashes extracted data. Storage-level hashes database records.
When a scientist questions a result six months later, you can prove your pipeline didn't alter the data.
For continuous reconciliation, build a simple dashboard showing instruments with no data in 24 hours (might be offline), validation failure rate by instrument (needs maintenance?), average delay between file creation and processing, and number of files requiring manual review.
Don't make it complicated. Simple metrics catch 95% of problems.
When automated capture makes sense (and when it doesn't)
Not every instrument needs automated integration. A $50k integration for a pH meter that generates ten readings per week doesn't make financial sense.
Automated capture makes sense when you process more than 20 samples per day, manual transcription errors exceed 0.1%, data entry takes more than 1 hour daily, you need results in near-real-time, or regulatory compliance requires audit trails.
It doesn't make sense when the instrument generates fewer than 50 data points weekly, output format changes with every method, you're still validating analytical methods, or the instrument is scheduled for replacement.
For borderline cases, start with semi-automated capture: automatically collect files but manually trigger processing. This gives you data security without integration complexity.
Moving from brittle connectors to resilient operations
The path from unreliable instrument integration to smooth data flow isn't about finding the perfect connector pattern. It's about accepting that instruments will misbehave and building systems that handle chaos gracefully.
Modern operational platforms solve this by centralizing integration logic while distributing failure handling. Instead of point-to-point connections between instruments and LIMS, you build a data hub that speaks every instrument's dialect.
Each connector runs independently—if your mass spec integration fails, your HPLC data keeps flowing. Validation rules stay separate from parsing logic, so you can adjust thresholds without touching code. And because everything flows through a central platform, you get unified monitoring across all instruments.
The labs that successfully scale from 10 to 100+ instruments all follow this pattern. They stopped treating integration as a technical problem and started treating it as an operational workflow. Their data scientists spend time analyzing results, not debugging parser errors. Their lab managers know immediately when an instrument needs attention, not three weeks later when someone notices missing data.
The difference between labs drowning in integration problems and those running smoothly isn't technical sophistication—it's accepting that instrument data is messy and building systems designed for that reality. Once you stop expecting instruments to behave perfectly and start building for how they actually work, integration becomes just another operational workflow that runs reliably in the background.
Ready to upgrade your lab operations?
Join 500+ labs using Labioly to save time, reduce errors, and enhance productivity and compliance.