

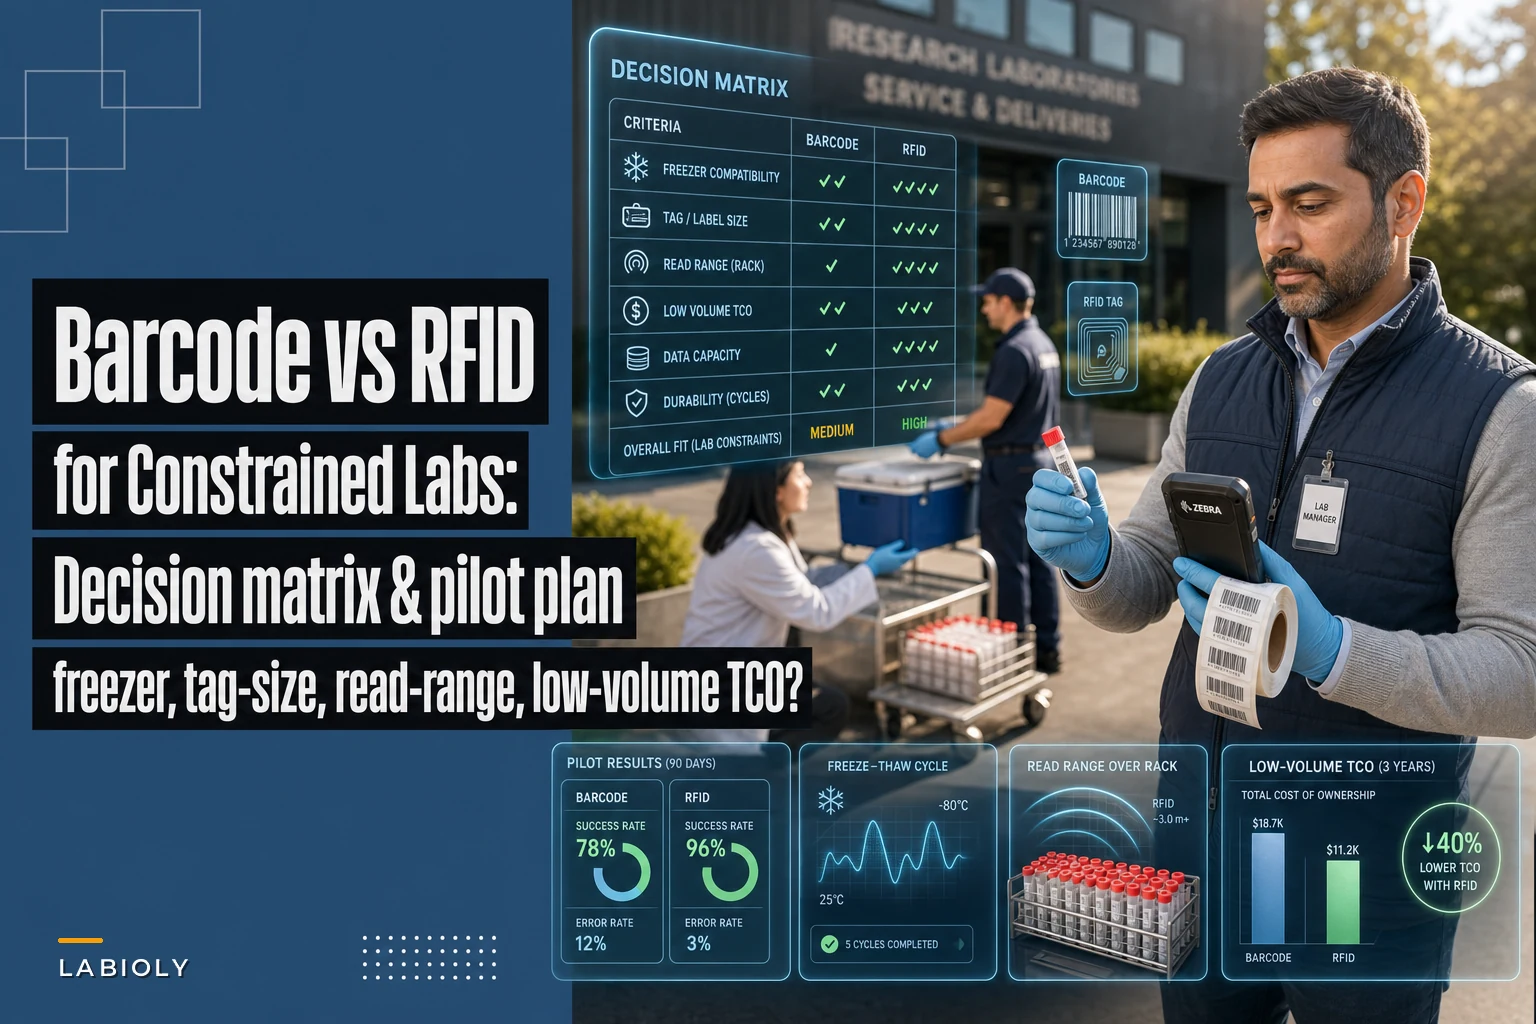

Walk into any research lab's -80°C freezer room and you'll see the same scene: techs squinting at frost-covered labels, manually logging sample locations into spreadsheets, and hoping the barcode scanner still works through the ice buildup. Some labs have already tried RFID tags, only to find the hardware stops working at liquid nitrogen temperatures or the readers can't penetrate metal freezer racks. The barcode vs RFID debate isn't really about which technology is better. It's about understanding your specific lab constraints and building a pilot that actually tests what matters. Teams waste months piloting the wrong things or committing to technology that works beautifully in theory but falls apart against real-world constraints.
Why standard tracking comparisons fail in research labs
Most barcode vs RFID comparisons are written for warehouses or hospitals. They'll tell you RFID reads faster, tracks multiple items at once, and cuts down on manual scanning. All true—and mostly irrelevant when you're dealing with 0.5mL microtubes in aluminum cryoboxes at -196°C.
Research labs face constraints that break standard tracking approaches.
Temperature extremes destroy technology. Standard RFID tags fail below -40°C. Batteries die, antennas crack, adhesives fail. Even specialized cryogenic tags struggle with repeated thermal cycling between liquid nitrogen and room temperature. Thermal transfer barcode labels can survive these conditions—but only if you pick the right materials and actually validate them before committing.
Small sample containers limit tag size. A 0.5mL microtube has maybe 8mm x 20mm of usable surface. That's barely enough for a readable 2D barcode, let alone an RFID tag with decent read range. Some labs try wrapping tags around tube caps, but then you can't read them once tubes are packed into boxes.
Metal interference blocks signals. Aluminum cryoboxes, stainless steel racks, and metal freezer walls create RF dead zones. Labs end up pulling samples out of storage just to scan them—which defeats the entire point. Some teams install RFID readers on every freezer shelf and still see 60% read rates because of interference patterns nobody anticipated during planning.
Low sample volumes kill the ROI math. A pharmaceutical warehouse might track millions of items per year. A research lab might process 5,000 samples a month. When RFID tags cost $0.50–$2.00 each versus around $0.02 for barcode labels, the numbers get ugly fast. Add reader infrastructure and suddenly you're staring at multi-year payback periods for marginal efficiency gains.
Building your constraint-based decision matrix
Forget generic feature comparisons. Build a decision matrix around your actual operational constraints.
Eliminate lab bottlenecks and errors.
Labioly helps you monitor, manage, and report lab activities efficiently and compliantly.
- Real-time sample tracking
- Inventory and supply alerts
- Staff workflow coordination
No credit card required
Start by mapping your non-negotiables:
Temperature range requirements
-
Storage temperature (room temp, 4°C, -20°C, -80°C, liquid nitrogen)
-
Thermal cycling frequency
-
Condensation exposure
-
Required tag survival rate (99%, 99.9%, 99.99%)
Physical space constraints
-
Maximum tag dimensions
-
Container material (plastic, glass, metal)
-
Storage density (tubes per box, boxes per rack)
-
Required read distance
Operational workflow constraints
-
Scanning frequency per sample
-
Batch processing requirements
-
Chain of custody documentation needs
-
Integration with existing LIMS
Budget constraints
-
Per-sample consumable cost threshold
-
Capital equipment budget
-
IT infrastructure limitations
-
Maintenance resource availability
Weight each constraint based on actual operational impact. A constraint that causes daily workflow problems should weigh heavier than one that only affects monthly inventory counts.
Here's a realistic scoring framework to get you started:
| Constraint Category | Weight | Barcode Score | RFID Score |
|---|---|---|---|
| Temperature survival (-80°C) | 30% | 9/10 | 4/10 |
| Small tube compatibility | 25% | 8/10 | 3/10 |
| Read through metal boxes | 20% | 2/10 | 6/10 |
| Cost per sample <$0.10 | 15% | 10/10 | 2/10 |
| Batch scanning capability | 10% | 3/10 | 9/10 |
Your weights will look different. A lab processing thousands of samples daily might push batch scanning to 40%. A lab with mostly room-temperature storage might drop temperature survival to 10%. This table is a starting point, not a prescription.
Designing pilots that actually answer your questions
Most tracking pilots fail because they test the wrong things. Teams spend weeks measuring read speeds when their real bottleneck is label printing. Or they pilot RFID in a clean test freezer with no metal racks, then act surprised when production deployment falls apart.
Structure your pilot around failure mode discovery, not success demonstration.
Phase 1: Constraint stress testing (2 weeks)
Don't start with workflow testing. First verify the technology actually survives your environment.
For barcode systems:
-
Print 100 labels and run them through 10 freeze-thaw cycles
-
Test scanner performance through frost buildup
-
Measure read rates at maximum storage density
-
Document label degradation patterns
For RFID systems:
-
Test read rates through your actual storage containers
-
Map dead zones in freezers with metal components
-
Measure tag survival after temperature cycling
-
Test bulk reading accuracy with dense sample placement
Document everything. When tags fail at -80°C, you need to know if it's immediate or after 30 days of storage. When barcodes become unreadable, you need to know whether it's frost, condensation, or adhesive failure.
Phase 2: Workflow integration testing (2 weeks)
Only move here after confirming basic technology survival.
Pick three representative workflows:
-
High-frequency process (daily sample retrieval)
-
Batch process (weekly inventory count)
-
Exception process (sample investigation)
Measure operational metrics that actually matter:
-
Time per sample transaction
-
Error rate by process step
-
Rework frequency
-
Training time for new users
Compare against your current baseline. If manual logging takes 8 seconds per sample with a 2% error rate, your new system needs to beat both numbers to justify deployment costs.
Phase 3: Scale testing (1 week)
Test at roughly 10x your normal daily volume. Systems that handle 50 samples per day without issue can fall apart at 500.
Key scale tests:
-
Database performance under load
-
Label printer throughput limits
-
Scanner battery life during continuous use
-
Network bandwidth for RFID bulk reads
-
Concurrent user performance
Graph trends, not just averages. A system with a 99% average read rate but daily 85% dips during freezer defrost cycles isn't actually 99% reliable—it just looks that way when you roll everything into a monthly summary.
Here's a simple visual of the pilot workflow you can use to align stakeholders and technicians.
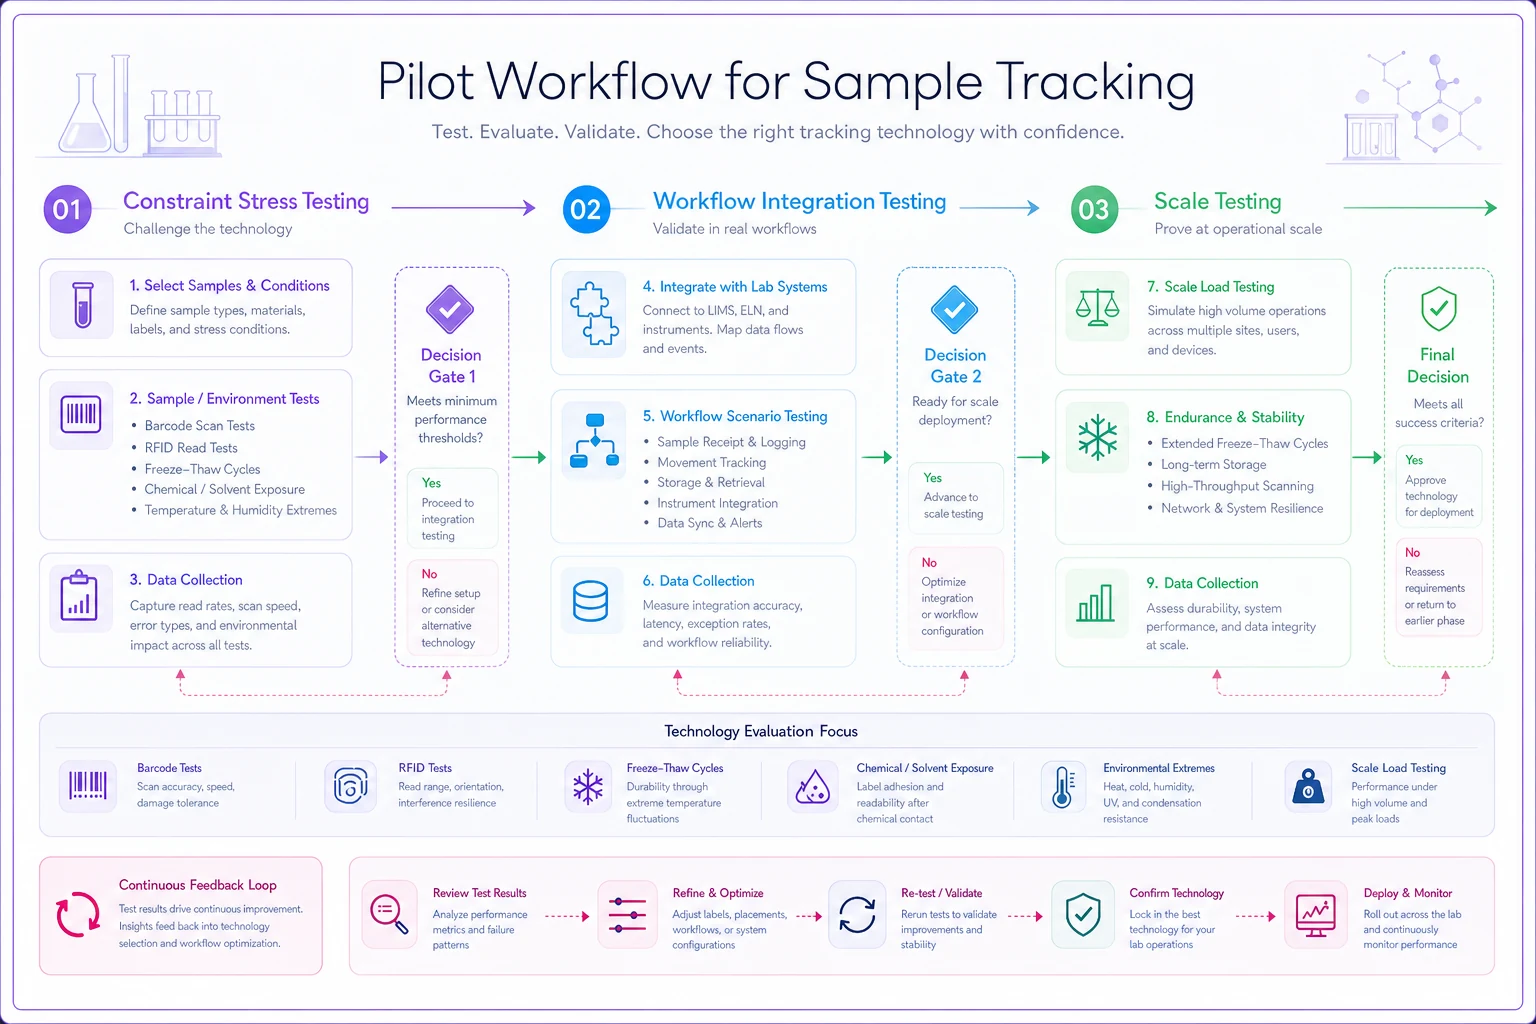
Use this to brief technicians before you start so everyone knows what failure modes to look for.
Run the constraint stress tests in a small but fully representative set of storage units (including metal racks) to catch interference issues early.
Structure your pilot documentation so a new reader can recreate any failing test from raw steps and results.
Success metrics that predict production reality
Generic metrics like "read accuracy" or "scanning speed" don't predict production success. Define metrics that reflect actual operational impact.
Primary success metrics:
Sample traceability completeness: Percentage of samples with unbroken chain of custody from receipt to disposal. Target: >99.5%
Retrieval time per sample: Total time from request to sample in hand, including search, retrieval, and verification. Target: <3 minutes for any sample
Inventory accuracy: Percentage of samples found in their documented location during spot checks. Target: >98%
Mislabeling rate: Samples with incorrect or unreadable labels per 1,000 processed. Target: <2 per 1,000
Secondary success metrics:
Technology survival rate: Percentage of tags or labels remaining readable after 6 months in storage. Target: >99%
Training time to competency: Hours required for a new user to reach 95% transaction accuracy. Target: <4 hours
System availability: Percentage of time the tracking system is operational during working hours. Target: >99%
Cost per tracked sample: Total cost including consumables, labor, and amortized equipment. Target: varies by lab scale
Track these daily during the pilot. Graph trends, not just averages. A system with a 99% average read rate but daily 85% dips during freezer defrost cycles isn't actually 99% reliable—it just looks that way when you roll everything into a monthly summary.
Common failure modes and early warning signs
Catching failure patterns early saves months of wasted effort.
Barcode failure modes:
Progressive label degradation: Labels read fine at first but fail after repeated freeze-thaw cycles. Early sign: increasing scan attempt rates week over week.
Frost accumulation blindness: Scanners can't read through ice crystals. Early sign: morning scan failures that clear up after samples warm slightly.
Adhesive creep: Labels slowly peel at the edges and eventually fall off. Early sign: operators pressing labels down before scanning.
Print quality degradation: Printer ribbons or printheads wearing faster than expected. Early sign: contrast ratio dropping below scanner thresholds.
RFID failure modes:
Tag mortality cascade: Tags fail in clusters due to manufacturing defects or temperature stress. Early sign: sudden read failure clusters in specific storage locations.
Reader interference patterns: Metal objects create unpredictable dead zones. Early sign: inconsistent read rates for identical sample arrangements.
Database synchronization lag: Bulk reads overwhelm system processing capacity. Early sign: growing delays between scan and database update.
Power budget problems: Battery-powered tags dying faster than the spec sheet suggests. Early sign: read range decreasing gradually over time.
Set alerts when metrics drift toward failure thresholds. A 2% daily degradation in read rates means complete failure within roughly 50 days—long enough to miss if you're only checking monthly.
Making the decision: Beyond technology comparison
The barcode vs RFID choice often gets made for non-technical reasons that don't surface until the pilot is already underway.
Organizational readiness factors:
IT support capability: RFID systems need more complex infrastructure. Can your IT team troubleshoot RF interference patterns, or are they better equipped to restart printers and swap cables?
Vendor lock-in tolerance: RFID systems often use proprietary protocols. Are you comfortable with single-vendor dependence for critical tracking infrastructure?
Regulatory flexibility: Some compliance frameworks explicitly require barcode tracking. Others accept any validated system. Know your constraints before piloting.
Failure recovery processes: When tracking fails, what's your backup? Barcode systems can fall back to manual entry. RFID systems might leave you completely blind.
For most constrained research labs, the honest answer isn't really "barcode vs RFID"—it's "barcode now, maybe RFID later." Start with proven barcode systems that survive your temperature extremes and space constraints. Build solid processes and data infrastructure first. Then consider RFID for specific high-value workflows where batch reading actually justifies the added complexity.
Implementation roadmap for resource-constrained labs
Whether you go barcode or RFID, a phased rollout minimizes risk and gives you real data before you commit further.
Month 1: Foundation
-
Document current tracking processes and failure points
-
Define success metrics and measurement systems
-
Select a pilot area with contained scope
-
Procure minimal equipment for testing
Month 2: Technical validation
-
Run constraint stress tests
-
Document all failure modes
-
Adjust technology selection if needed
-
Build basic integration connections
Month 3: Process validation
-
Test selected workflows with real users
-
Measure against success metrics
-
Identify process adjustments needed
-
Create training materials
Month 4: Limited production
-
Deploy in a single lab area
-
Run parallel with the existing system
-
Daily metric monitoring
-
Weekly process refinement
Month 5: Scale decision
-
Compare results to success criteria
-
Calculate actual ROI with real data
-
Make go/no-go decision for full deployment
-
Document lessons learned
This timeline assumes you're choosing between validated technologies, not building custom systems. Add 3–6 months if you need custom software development or complex LIMS integration.
The operational reality check
The best tracking system is the one your team actually uses correctly. Some labs spend $200k on RFID infrastructure, then watch researchers bypass it entirely because scanning takes too long when they're rushing between experiments. Meanwhile, another lab runs cleanly on a few thousand dollars worth of barcode printers and scanners because they designed around actual workflows instead of an ideal scenario.
Your decision matrix might point clearly toward one technology, but if the pilot surfaces unexpected failure modes, be ready to pivot. The goal isn't to prove your initial choice was right—it's to find what actually works given your specific mix of constraints, workflows, and resources.
AI-powered lab management platforms can help bridge the gap between simple barcode tracking and more complex RFID setups. Some use computer vision to read damaged barcodes, flag label degradation before it becomes a tracking gap, or surface chain-of-custody issues that would otherwise go unnoticed until an audit. That kind of operational support can meaningfully extend the useful life of simpler tracking infrastructure. But even with those tools in place, you still need the right foundational tracking technology for your specific constraints.
Start with the smallest viable pilot that tests your hardest constraints. Measure what actually impacts your operations. In constrained lab environments, boring reliability beats exciting features every time.
Start with the smallest viable pilot that tests your hardest constraints. Measure what actually impacts your operations. In constrained lab environments, boring reliability beats exciting features every time.
Ready to upgrade your lab operations?
Join 500+ labs using Labioly to save time, reduce errors, and enhance productivity and compliance.