

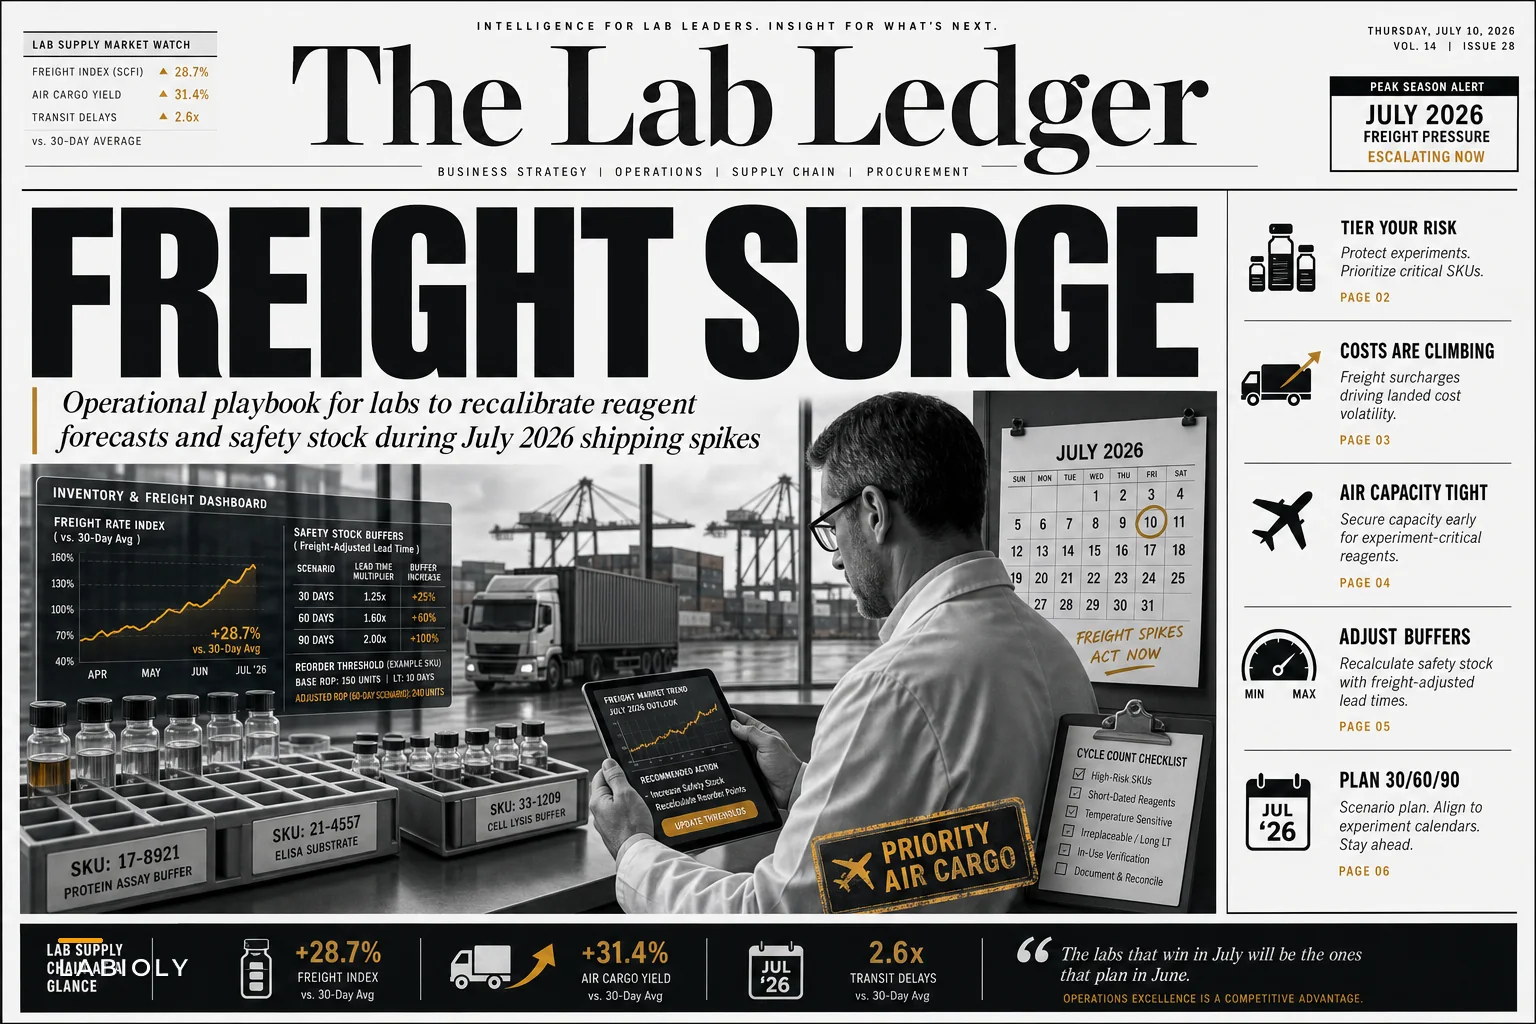

The freight market just threw a wrench into summer research schedules. Maersk's July 2026 North America update shows spot rates jumping 18-25% on major shipping lanes, with inland capacity constraints creating 5-10 day delays on what used to be standard 3-day deliveries. Port congestion in Long Beach and Newark means your supplier's "2-week lead time" is quietly becoming closer to 4 weeks.
For labs running time-sensitive experiments, that's an immediate problem. The ELISA kit you need for next Tuesday's patient samples. The antibodies for grant deadline experiments. The specialty media for a cell culture expansion. All sitting in a logistics bottleneck that standard reagent forecasting never accounted for.
The deeper issue isn't just this freight surge. Most lab inventory systems treat supply chain volatility as background noise rather than something worth planning around. When freight markets destabilize, the assumptions behind your forecasting collapse—and suddenly you're expediting orders at three times the normal shipping cost or watching experiments stall because critical supplies are somewhere in transit.
The cascading failure pattern when reagent forecasting ignores freight volatility
Labs usually discover their forecasting gaps at the worst possible moment. A PI commits to a 500-sample validation study based on normal reagent availability. The lab manager places orders using standard 2-week lead times. Then freight delays push delivery to week 3 or 4, right when samples start arriving.
Now you're burning through safety stock that was meant for actual emergencies, not systematic delays. The validation study gets pushed. Grant milestones slip. Clinical trial enrollment pauses. What started as a shipping delay turns into an operational mess that takes months to untangle.
The financial damage compounds fast. Emergency overnight shipping for a single antibody order can run $800-1,200 versus maybe $50 for ground shipping. Multiply that across 15-20 critical reagents per month and you're looking at $10-15k in unbudgeted freight charges. Idle instrument time from delayed consumables adds another $2-3k per week in lost throughput on top of that.
Labs running tight budgets end up stuck between two bad options: burn contingency funds on expedited shipping or accept delays that might compromise years of work. Neither is sustainable when freight volatility stops being temporary.
Why standard min-max models break during supply chain disruptions
Most labs run some version of min-max inventory planning. Stock hits the minimum threshold, you reorder to the maximum level. Simple, and it works fine when lead times stay predictable.
Eliminate lab bottlenecks and errors.
Labioly helps you monitor, manage, and report lab activities efficiently and compliantly.
- Real-time sample tracking
- Inventory and supply alerts
- Staff workflow coordination
No credit card required
It falls apart when lead time variance exceeds your safety stock buffer. A reagent with a 14-day average lead time might swing between 10 and 25 days during freight disruptions. Safety stock calculated for ±3 days of variance can't absorb ±11 days of reality.
Traditional reagent forecasting treats consumption rate as the primary variable and lead time as a constant. During freight volatility, that's basically backwards. Lead time becomes the dominant risk factor while consumption stays relatively stable. The model ends up optimizing for the wrong thing.
Academic labs have it harder here. Unlike clinical labs with predictable test volumes, research consumption swings wildly depending on experimental design. One week you're using 10 vials of primary antibody, the next it's 50 for a dose-response study. Layer freight uncertainty on top of consumption uncertainty and inventory planning starts feeling like informed guessing at best.
Building a freight-adjusted safety stock model
Adding more buffer stock isn't really the answer—it ties up budget and creates expiration risk. What actually helps is safety stock that adjusts based on current freight conditions and upcoming experimental demand.
Start by segmenting reagents into criticality tiers:
Tier 1 - Experiment Critical
-
Cannot substitute
-
Experiment fails without it
-
Examples
validated antibodies, patient-specific reagents, time-sensitive enzymes
-
Safety stock
4-6 weeks during freight volatility
Tier 2 - Workflow Critical
-
Can substitute but requires validation effort
-
Delays multiple experiments
-
Examples
common buffers, standard media, routine consumables
-
Safety stock
2-3 weeks during freight volatility
Tier 3 - Convenience Items
-
Multiple alternatives available
-
Can make in-house if needed
-
Examples
basic salts, common solvents, general plasticware
-
Safety stock
1 week or just-in-time
The key difference from standard ABC analysis is that you're categorizing based on substitutability and experimental impact, not just cost or usage volume.
For Tier 1 items, run a dual-threshold reorder system. The primary threshold triggers normal orders. An elevated "freight alert" threshold activates during known disruption periods. When C.H. Robinson's freight update signals tightening capacity, you shift to the higher threshold automatically.
[Monitor Freight Indicators] → Green / Yellow / Red State ↓ [Assign Reagent Tier 1 / 2 / 3] ↓ [Apply Freight-Adjusted Safety Stock Buffer] ↓ [Trigger Reorder at Adjusted Threshold] ↓ [Update as Freight Conditions Change]
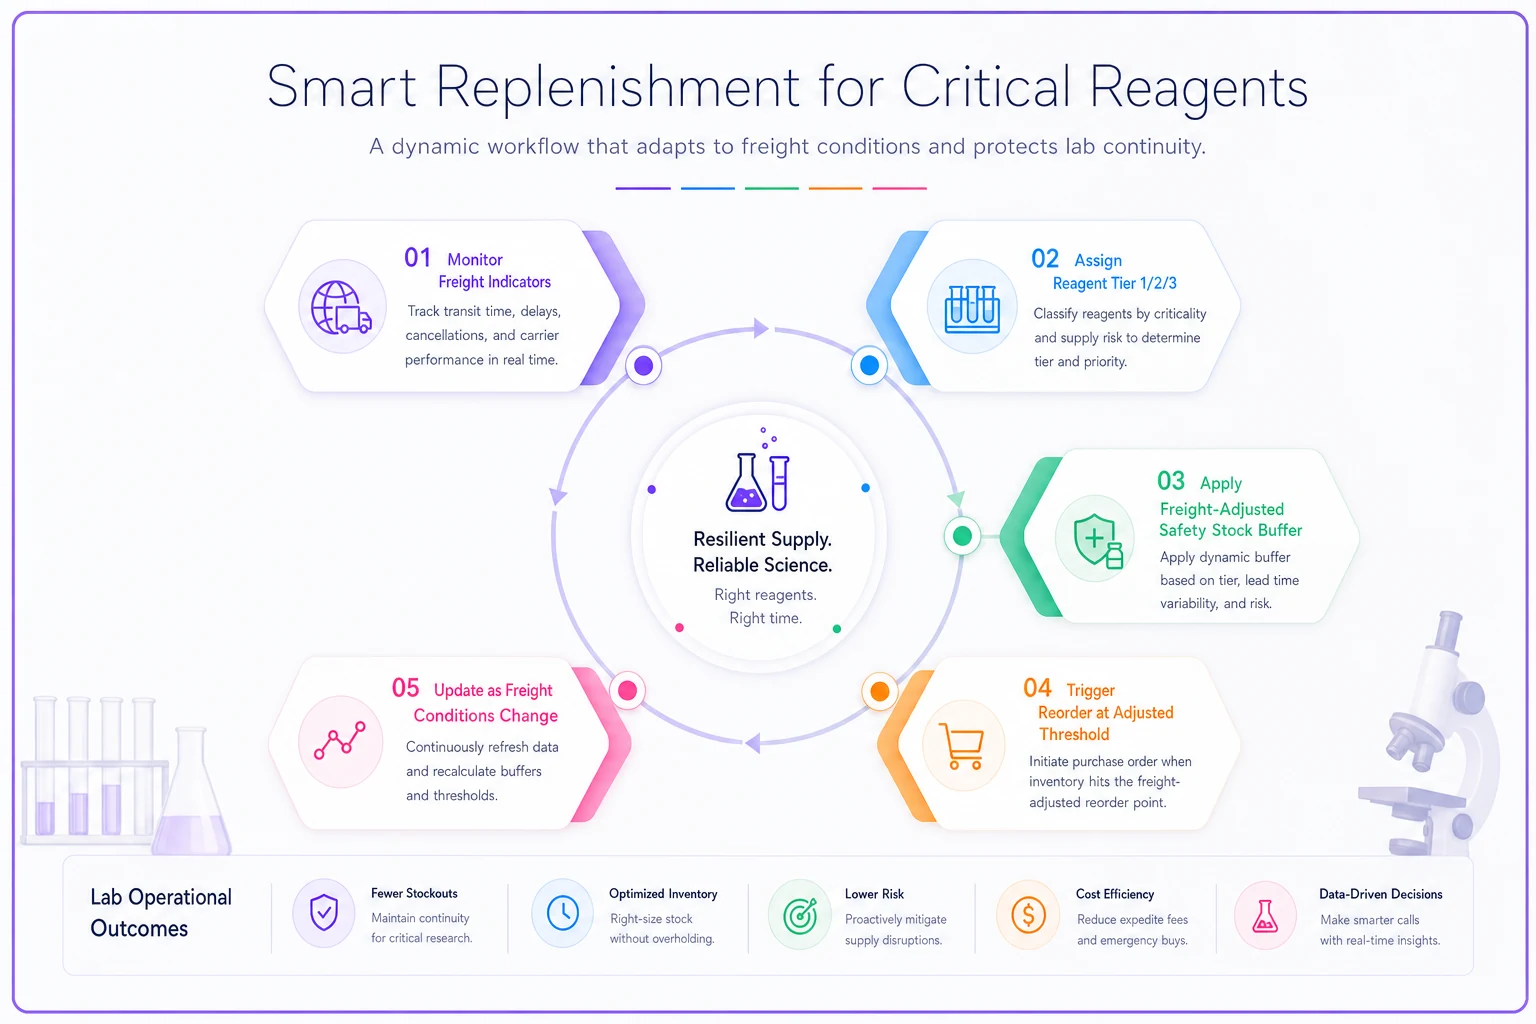
The diagram illustrates the freight-adjusted safety stock workflow.
This isn't complicated in theory. The hard part is actually keeping freight state current and making sure reorder thresholds reflect it.
Protocol-driven demand sensing for volatile periods
Generic consumption averaging breaks down when research priorities shift fast. A lab running standard Western blots pivots to high-throughput screening for a new grant. Reagent consumption jumps 5x overnight, but the forecast model won't catch that for weeks.
The fix is connecting reagent forecasting directly to experimental protocols and schedules. When a PI submits a protocol requiring 200 96-well plates over 3 weeks, that demand flows into the forecast immediately—no waiting for historical data to catch up.
Build a simple protocol-to-reagent mapping system:
| Protocol Type | Primary Reagents | Consumption Rate | Lead Time Buffer |
|---|---|---|---|
| Cell expansion | Growth media (2L/week), FBS (200ml/week) | Linear with cell count | 3 weeks |
| ELISA validation | Antibody pairs (1 kit/100 samples), TMB substrate | Batch-dependent | 4 weeks |
| qPCR screening | Master mix (500 reactions/study), primers | Stepwise by plate | 2 weeks |
| Western blot | Primary antibodies (1:1000 dilution), ECL reagent | 20 blots/vial | 3 weeks |
This mapping becomes your demand sensing engine. As protocols get approved and scheduled, the system calculates required reagents and checks against current inventory plus incoming orders. Gaps get flagged before they turn into emergencies.
The real value comes when you layer freight intelligence on top. If a protocol needs reagents in week 3 but current freight delays are averaging 12 days, the system triggers orders in week 1 instead of week 2. Most labs still handle this with manual calculations or Excel sheets that genuinely can't keep up when conditions are shifting weekly.
Regional supplier diversification strategies
Single-source suppliers become single points of failure during freight disruptions. A specialty antibody only available from a vendor in Denmark creates a real problem when North Atlantic shipping backs up.
Map your critical reagents to supplier geography and identify where you're concentrated:
-
Over 50% of Tier 1 reagents sourced from one region = meaningful vulnerability
-
Transcontinental shipping for time-sensitive items = risk worth eliminating
-
Single-source reagents with no qualified alternatives = needs 6+ weeks of safety stock
For each concentrated risk, build a mitigation plan. Sometimes that means qualifying a backup supplier even if they cost 20% more. That premium is basically insurance. A backup vendor relationship that sits dormant for 11 months might save your research program in month 12.
Also pay attention to warehouse locations, not just company headquarters. A "US-based" supplier might actually be shipping from their European distribution center. During freight crunches, those extra logistics hops stack delays in ways that aren't obvious until it's already a problem.
Cycle count adjustments for higher inventory variance
Freight volatility amplifies inventory accuracy problems. When you're constantly expediting orders and pulling from safety stock more often than planned, physical counts drift from system records faster than usual.
Quarterly cycle counts can't keep up. You need targeted counts on high-velocity items experiencing the most movement. If you're pulling from safety stock weekly instead of monthly, count those items weekly.
Focus cycle counts where errors tend to accumulate:
-
Items moved from safety stock to active inventory
-
Reagents split between multiple experiments
-
Temperature-sensitive items with complex storage requirements
-
High-value reagents where small variances actually matter
Track variance trends, not just point-in-time discrepancies. If antibody inventory variances climbed from ±2% to ±8% over three counts, something in the process is breaking down beyond normal measurement error.
This connects directly to your broader reagent demand forecasting system. When cycle counts show systematic overconsumption of specific reagents, that data feeds back into forward-looking forecasts. The model learns that during freight disruptions, actual consumption tends to run 15-20% above plan—partly from waste due to expiring safety stock, partly from inefficient small-batch ordering.
Cost-per-experiment implications of freight surcharges
Budget models rarely account for freight cost volatility hitting operating expenses. A grant allocated $50,000 for reagents based on 2024 pricing might run $58,000-62,000 in real costs once you add 25% freight surcharges and expedited shipping needs.
Build a true cost-per-experiment model that includes everything:
-
Base reagent cost
-
Standard freight allocation (typically 3-5% of order value)
-
Current freight surge premium (15-25% during peak volatility)
-
Expedited shipping reserve (budget for 2-3 emergency shipments monthly)
-
Inventory carrying cost for expanded safety stock
For a typical molecular biology experiment using $3,000 in reagents, the full breakdown might look like:
-
Reagents
$3,000
-
Normal freight
$150
-
Surge premium
$450
-
Expedite reserve
$200
-
Extra safety stock carrying cost
$100
-
Total real cost
$3,900
That 30% premium changes how you think about experimental priorities. Consolidating related experiments to share reagent preparations starts making real economic sense. Running partial experiments just to burn through expiring reagents becomes something you can actually quantify as a bad call.
The model doesn't need to be complicated—it just needs to exist. Most labs discover these cost overruns after the fact when reconciling against budgets, not early enough to make decisions with.
Implementing trigger-based reorder automation
Manual reorder processes can't respond fast enough when freight conditions are shifting week to week. By the time someone notices stock running low, processes the paperwork, and submits the order, another week of safety stock is gone.
Build escalating triggers that adjust to conditions:
Green state (normal freight):
-
Reorder at 3-week supply
-
Standard shipping methods
-
Normal approval workflows
Yellow state (freight delays 3-7 days):
-
Reorder at 5-week supply
-
Ground expedite authorized
-
Simplified approval for critical items
Red state (freight delays 7+ days):
-
Reorder at 8-week supply
-
Air freight pre-authorized for Tier 1 items
-
Blanket PO activation for qualified backup suppliers
The trigger system needs a live connection to freight data. Updating freight status manually once a week means you're always responding to last week's problem instead of preventing next week's.
Set up automated alerts from freight carriers and logistics providers. When spot rates spike above baseline or port congestion reports show increasing dwell times, the system shifts to yellow or red state protocols without waiting for someone to notice. Lab staff don't need to become freight experts—they just follow adjusted reorder points.
Platform integration for real-time supply chain visibility
Excel-based reagent tracking can't handle this level of supply chain complexity. You need real-time visibility across ordering, inventory, and experimental demand—and those things need to actually talk to each other.
The challenge usually isn't technical, it's operational. Purchasing systems, inventory databases, and experimental scheduling platforms run separately with different data structures. Manual transfers between them create lag that gets worse during volatile periods.
Operational software built around reagent forecasting centralizes the core planning logic while maintaining connections to specialized systems. Experimental protocols flow in from your LIMS or scheduling system. Purchase orders sync with procurement. Inventory counts update from barcode scans or automated sensors.
The AI automation layer catches patterns that are easy to miss manually. When three different experiments suddenly request the same obscure reagent, the system flags the potential shortage before anyone submits competing orders. When freight delays consistently correlate with specific suppliers or shipping routes, lead time buffers for those items adjust automatically rather than waiting for someone to update a spreadsheet.
That kind of coordination matters during freight volatility. The platform might surface that West Coast port delays affect 40% of your Tier 1 reagents and flag East Coast alternatives. Or it spots that consolidating certain items into bulk orders would qualify for priority freight allocation during a capacity crunch. Smaller research labs often resist this level of systematization, figuring it's overkill for their size. But when a single stockout can derail months of research, proper operational infrastructure tends to pay back faster than expected.
From reactive scrambling to proactive preparation
Freight volatility isn't going away. Between climate events, port labor disputes, and shifting global trade patterns, supply chain disruption has basically become the baseline. Labs that treat every freight surge as a surprise emergency will exhaust their budgets and wear out their staff.
The labs handling these disruptions well have moved beyond simple min-max models to systems that actually adjust to conditions. They're watching leading indicators like freight rates and port congestion rather than waiting for stockouts to signal something went wrong.
Start with the basics: segment inventory by criticality, set freight-adjusted safety stock levels, and build protocol-driven demand visibility. Then layer in the harder work—regional supplier diversification, automated reorder triggers, and integrated platform management.
The July 2026 freight surge is just the latest reminder that operational competence in research isn't optional. It's the difference between labs that consistently deliver results and labs that spend half their time explaining why they can't.
Ready to upgrade your lab operations?
Join 500+ labs using Labioly to save time, reduce errors, and enhance productivity and compliance.