
Your lab cycle count reconciliation system probably looks reasonable on paper. Monthly counts for critical reagents, quarterly for everything else, maybe annual physical inventory. Standard tolerance of 5% across the board. Simple enough.
Stop Treating Every Reagent Like It Needs the Same Counting Schedule
Except this approach completely ignores how labs actually consume inventory. A PCR lab running 400 reactions daily has fundamentally different reconciliation needs than a protein crystallography facility processing 20 samples weekly. Yet most labs apply the same counting strategy to $8,000 antibodies and $12 buffer solutions.
It gets worse. Labs typically discover discrepancies weeks after they occur, making root cause analysis nearly impossible. Was it a recording error during receipt? Undocumented borrowing between benches? A temperature excursion that quietly destroyed inventory value? By the time you notice that vial of monoclonal antibody is missing, the trail has gone cold.
The Hidden Cost Structure of Poor Reconciliation
Bad lab cycle count reconciliation creates three distinct cost buckets that compound over time. First, the immediate inventory loss—missing reagents, expired materials discovered too late, write-offs from contamination. A mid-size diagnostic lab processing around 200 samples daily can lose $35,000–$45,000 annually in unaccounted inventory alone.
Eliminate lab bottlenecks and errors.
Labioly helps you monitor, manage, and report lab activities efficiently and compliantly.
- Real-time sample tracking
- Inventory and supply alerts
- Staff workflow coordination
No credit card required
Second comes disruption cost. When reconciliation fails, experiments get delayed waiting for emergency orders. Technicians waste hours hunting for materials that should be there but aren't. One proteomics lab tracked roughly 3.5 hours weekly per technician spent on what I'd call "inventory archaeology"—finding materials that existed somewhere but weren't where the records said they were.
The third bucket hits hardest: compliance failures. FDA inspections, CAP audits, ISO certifications—they all scrutinize inventory controls. Poor reconciliation leads to citations, corrective actions, and in serious cases, suspended certifications. Remediation alone often runs past $100,000, not counting lost business during suspension.
What makes this frustrating is that labs usually respond to problems by increasing counting frequency, adding labor without fixing anything fundamental. The real issue is that their sampling strategy doesn't match their consumption patterns.
Risk-Based Sampling: Match Your Counting to Your Consumption Patterns
Effective lab cycle count reconciliation comes down to matching sampling frequency to both value and variability. High-value items with stable consumption need different treatment than low-value items with erratic usage patterns.
Critical reagents (master mixes, primers, probes): These directly impact test results and patient care. Count weekly using statistical sampling—not everything, but enough to detect systemic issues. For a lab with around 200 SKUs in this category, sampling 20–25 items weekly gives you roughly 95% confidence in catching problems.
Controlled substances: Legal requirements dictate daily reconciliation. No sampling—100% verification against usage logs.
General consumables (tips, tubes, plates): High volume, low individual value. Monthly cycle counts using ABC analysis. The top 20% by volume get counted monthly, the middle 60% quarterly, the bottom 20% annually.
Equipment-specific consumables (columns, cartridges, maintenance kits): Tie counts to equipment usage cycles. If your HPLC runs 50 samples between column changes, count columns every 40–45 runs, not on calendar intervals.
Sampling strategy also needs to account for storage conditions. Freezer inventories need more frequent verification than room temperature storage—not because theft risk is higher, but because access logging is typically worse and temperature excursions can silently destroy inventory value without anyone noticing.
Setting Tolerance Thresholds That Actually Make Operational Sense
Generic 5% tolerance thresholds ignore fundamental differences between reagent types. A 5% variance in pipette tips means nothing. A 5% variance in patient samples requires immediate investigation.
Tolerance thresholds should reflect four factors:
Inherent measurement uncertainty: Some materials can't be counted precisely. Bulk chemicals, opened containers, materials stored in multiple locations—these need wider tolerances.
Consumption variability: Materials with consistent daily usage should have tight tolerances. Materials used sporadically for specific protocols need wider bands.
Financial materiality: A $10,000 antibody vial deserves zero tolerance. A box of latex gloves can tolerate 10% variance without needing an investigation.
Regulatory impact: GMP materials, materials used in validated processes, anything touching patient samples—strict tolerances regardless of value.
Here's how a clinical reference lab might structure this:
| Category | Example Items | Tolerance | Investigation Trigger |
|---|---|---|---|
| Patient Samples | Specimen tubes, biopsy samples | 0% | Any discrepancy |
| Critical Reagents | FDA-approved test kits | ±1% | Any variance |
| Controlled Substances | Narcotics, scheduled drugs | 0% | Any discrepancy |
| High-Value General | Antibodies >$1000/vial | ±2% | Single item variance |
| Standard Reagents | Buffers, media, enzymes | ±5% | Pattern across multiple counts |
| Consumables | Tips, tubes, gloves | ±10% | Monthly variance >15% |
The investigation trigger matters as much as the tolerance itself. Single variances are usually recording errors. Patterns mean something in the process is broken.
Exception SOPs: When Standard Procedures Break Down
Every lab has inventory scenarios where standard counting procedures fall apart. Exception SOPs keep these edge cases from derailing your entire reconciliation system.
Partial container reconciliation: You can't count individual primers in a 96-well plate or measure exact volumes in opened reagent bottles. The SOP should specify: photograph before first use, weigh if possible, track usage by protocol rather than physical count. Document expected depletion rate and flag variances from that rate, not absolute quantities.
Multi-location inventory: The same reagent stored in three freezers, two refrigerators, and a backup location. Standard counting would mean checking six locations for one SKU. Exception SOP: designate primary storage, count only primary during routine cycles, full reconciliation quarterly. Track transfers between locations through a simple real-time log.
Shared inventory between departments: Research and clinical labs sharing expensive reagents. Normal counting assigns inventory to one cost center. Exception SOP: maintain shadow inventory records for shared items, reconcile against combined usage logs, proportionally allocate variances based on documented usage ratios.
Kit components: Multi-part kits where components deplete at different rates. Counting "kits" becomes meaningless when you have 10 complete kits plus 47 extra buffer tubes sitting around. Exception SOP: track components individually once a kit is opened, establish par levels for commonly depleted components, maintain separate reorder triggers.
Hazardous materials: Some inventory can't be safely counted without extensive PPE or engineering controls. Exception SOP: count by container not volume, use material transfer logs as primary record, physical verification only during scheduled maintenance windows.
The goal with exception SOPs is to make reconciliation possible, not perfect. Attempting perfect counts that require excessive effort creates its own set of problems.
Building Spreadsheet Templates That Actually Get Used
Most labs still run critical reconciliation processes through spreadsheets. The difference between templates that stick and ones abandoned after two weeks is almost always operational design, not the formulas.
A functional cycle count template needs five core components:
-
Dynamic sampling generator
Don't make technicians figure out what to count. Use RANDBETWEEN functions tied to category rules. High-priority items appear more frequently. The spreadsheet tells them exactly which 30 items to count today.
-
Variance calculator with contextual thresholds
Don't just calculate percentage variance. Flag variances based on category-specific thresholds. Use conditional formatting to highlight issues requiring immediate action versus those for trend monitoring.
-
Exception handling fields
Include dropdown menus for common exceptions—"partial container," "multi-location," "pending receipt," "quarantined." These prevent simple exceptions from showing up as variances that need investigation.
-
Rolling accuracy metrics
Track accuracy by category, by technician, by day of week. Patterns matter more than individual counts. If accuracy consistently drops every Friday afternoon, you have a process problem, not a counting problem.
-
Investigation tracker
When variances exceed thresholds, document the investigation. Link variance records to outcomes: "found in wrong location," "data entry error," "undocumented usage," "actual loss." This builds institutional knowledge about where problems actually originate.
The template should calculate workload automatically. If cycle counts take more than 45 minutes daily, compliance drops fast. Sampling sizes should adjust based on available labor, not theoretical ideals.
Randomization Strategies That Catch Real Problems
Pure random sampling sounds statistically solid but misses how inventory problems actually develop in labs. Smart randomization adapts to your operational patterns.
Stratified random by risk: Don't randomly sample across all inventory. Randomly sample within risk categories. If you have 100 high-risk items and 1,000 low-risk items, pure random sampling might go weeks without touching critical inventory.
Time-blocked randomization: Inventory errors often cluster around specific events—shift changes, weekend coverage, month-end rushing. Block randomize to ensure sampling during these high-risk periods. If Friday afternoon consistently shows higher variances, increase Friday sampling frequency.
Location-weighted randomization: Inventory in high-traffic areas needs more frequent verification than backup storage. Weight your randomization by access frequency. That bench-top freezer everyone uses needs roughly 3x the sampling rate of the backup -80°C unit.
Usage-triggered sampling: Instead of pure calendar-based randomization, trigger counts based on consumption—after 25% depletion, 50% depletion, before reorder. This catches problems while the trail is still fresh.
Paired sampling: When counting one item, occasionally count related items. Counting extraction kits? Also count the specific columns they require. This catches kit completion issues before they disrupt operations.
The randomization should feel unpredictable enough to prevent gaming, but still follow patterns that match your actual risk profile.
Technology Integration Without Overwhelming Operations
Modern lab cycle count reconciliation benefits from operational tracking systems that connect inventory counts to actual workflow data. The technology should sharpen human judgment, not replace it.
Barcode scanning reduces transcription errors but doesn't eliminate counting. The scan confirms identity; humans still verify quantity. One genomics lab cut counting errors by around 73% just by adding $200 Bluetooth scanners to their existing spreadsheet system—no major overhaul required.
Temperature monitoring integration adds context for variances. That missing inventory might coincide with a freezer excursion. The counting process doesn't change, but investigations become more targeted.
Usage tracking through protocol management systems helps predict expected inventory levels. If your system knows you ran 12 PCR plates yesterday, it can flag when master mix consumption doesn't match expected depletion.
Don't try to change everything at once. Layer technology onto existing workflows. Start with highest-value improvements: barcode scanning for receiving, temperature alerts for critical storage, usage logging for expensive reagents. AI-assisted tools are most useful for exception detection—identifying unusual consumption patterns, flagging statistical anomalies in count data, predicting when reconciliation issues might occur based on historical trends. These don't replace human counting but make the counting more targeted and easier to sustain over time.
The Workflow Behind a Working System
A molecular diagnostics lab running around 300 COVID tests daily implemented this approach after struggling with regular stockouts and $4,000–$6,000 monthly in expired reagent write-offs under their traditional monthly counting setup.
The general flow of their new system looked like this:
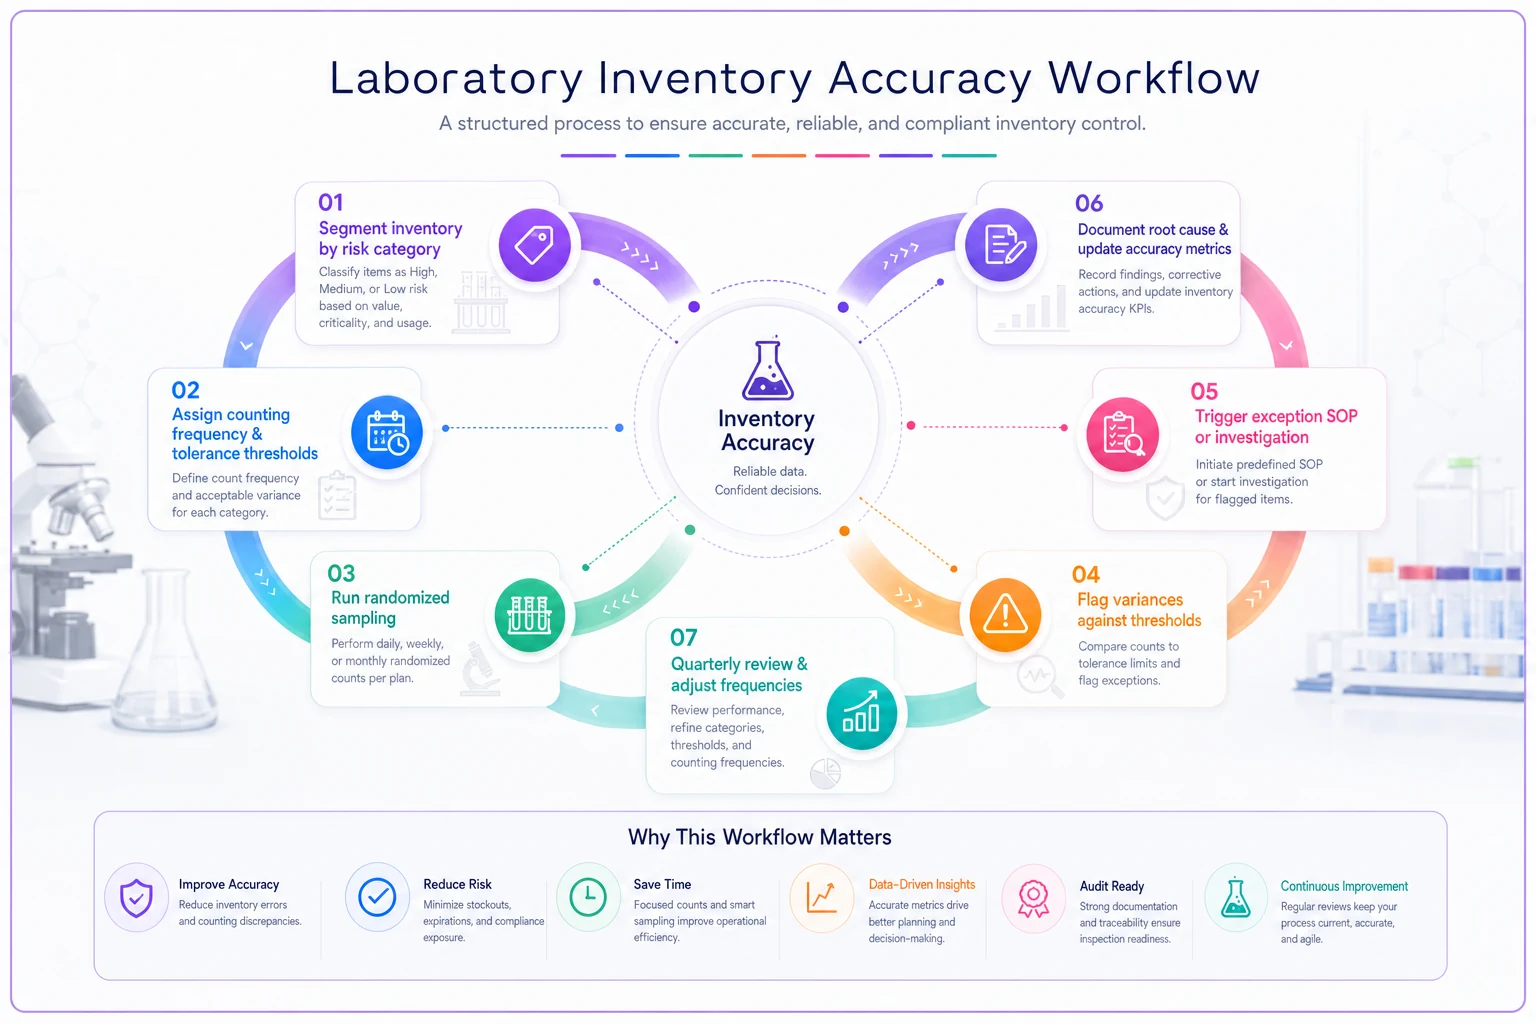
[Segment Inventory by Risk Category] ↓ [Assign Counting Frequency + Tolerance Thresholds] ↓ [Run Daily/Weekly/Monthly Sampling (Randomized)] ↓ [Flag Variances Against Category Thresholds] ↓ [Trigger Exception SOP or Investigation] ↓ [Document Root Cause + Update Accuracy Metrics] ↓ [Quarterly Review: Adjust Frequencies Based On Data]
The five-tier inventory segmentation they landed on covered roughly 400 SKUs across daily critical counts, weekly high-value sampling, monthly routine reagents, quarterly consumables, and separate exception handling for multi-component kits. Tolerance thresholds ranged from zero for patient samples and controls down to 10% for general plasticware.
Total time spent on counts actually dropped from around 20 hours monthly to 15 hours, while accuracy improved significantly. After six months: stockouts reduced by 85%, expired reagent write-offs dropped to under $500 monthly, investigation time decreased 60%, and the lab passed an FDA inspection with zero inventory-related observations.
The system worked because it matched counting effort to actual risk, not theoretical best practices.
Making Reconciliation Sustainable
The best lab cycle count reconciliation system is one that actually gets executed consistently. Perfection that requires heroic effort fails within months.
Rotate counting responsibilities. The same person counting the same inventory every week develops blind spots. Different eyes catch different issues—and spreading the work prevents any single person from becoming the "inventory person" who takes the blame when something goes wrong.
Document the reasoning behind exceptions. When someone marks "partial container—cannot count," require them to note the estimation method used. Over time this builds institutional knowledge and keeps exceptions from becoming excuses.
Review and adjust quarterly. If certain categories consistently show zero variance, reduce sampling frequency. If patterns emerge in specific storage areas, increase focus there. The system should evolve based on what the data shows, not stay static based on initial assumptions.
Connect reconciliation to broader operational metrics. Inventory accuracy affects on-time test completion, research productivity, cost per test. Making these connections visible helps reconciliation feel like valuable work rather than compliance busywork.
Most importantly, investigate problems quickly. The longer the gap between error and investigation, the less likely you'll find the root cause. A variance discovered today is traceable. The same variance discovered next month is archaeology.
Good lab cycle count reconciliation isn't about counting everything constantly. It's about counting the right things at the right frequency with tolerances that match your specific operational reality. The templates, SOPs, and automation tools just make that targeted counting sustainable day after day.
Ready to upgrade your lab operations?
Join 500+ labs using Labioly to save time, reduce errors, and enhance productivity and compliance.