
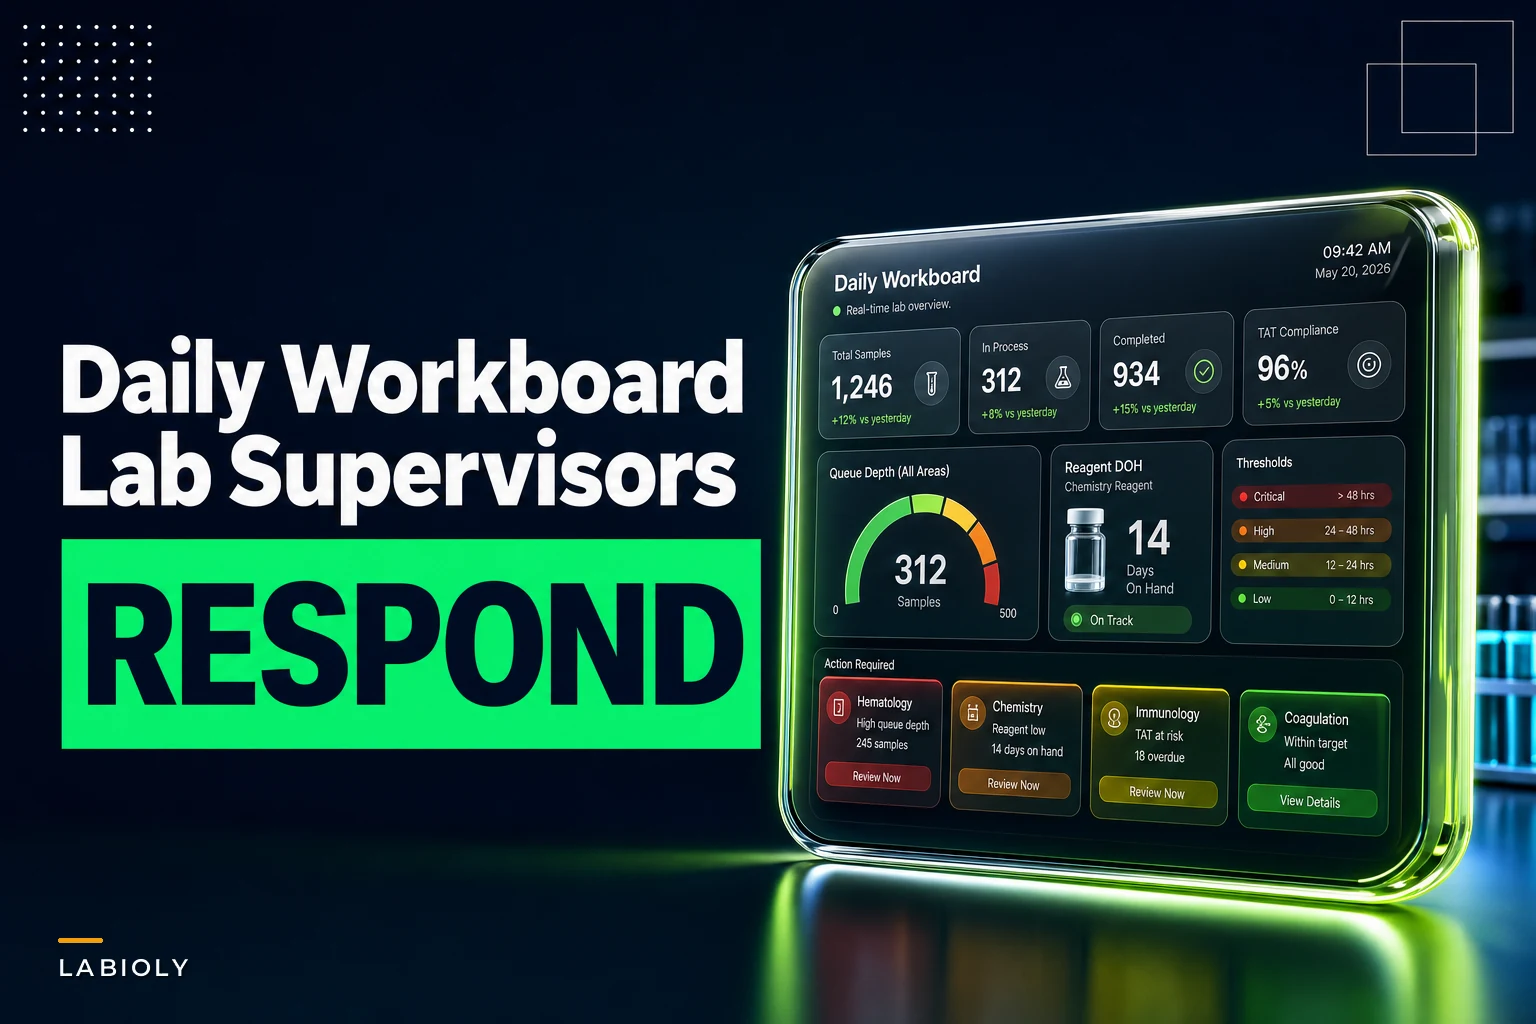

Most lab supervisors already have a whiteboard, a spreadsheet, or some LIMS dashboard that technically shows "how the lab is doing." The problem is timing. By the time a monthly report flags that turnaround slipped or a reagent hit zero, the damage happened three Tuesdays ago and nobody can reconstruct why.
The fix isn't more dashboards. It's a short-interval workboard — a one-week rolling view that a supervisor walks past every morning, reads in under two minutes, and acts on before lunch. This piece is about building that board: which two or three numbers actually belong on it, what thresholds trigger action, and what the person standing in front of it should physically do when a number goes red.
Keeping the scope narrow on purpose here. This is not a KPI philosophy article. If you want the strategic side of metrics, that's covered separately in the piece on operational KPIs and capacity planning. This is about the shift-level board that sits between strategy and chaos.
Why the weekly report is the wrong instrument
The monthly or even weekly report answers "how did we do." A workboard answers "what do I do right now." Those are different jobs, and most labs try to make one artifact do both.
The failure looks like this. A mid-size histology lab runs a Monday morning meeting off a slide deck. The deck shows last week's average turnaround was 2.3 days — within target. Everyone nods. What the deck hides is that Wednesday and Thursday were both terrible: queue depth spiked past 40 cases while one microtome was down, and the average washed it out. Nobody caught the Wednesday spike on Wednesday, when a supervisor could have pulled someone off another bench for two hours and cleared it.
Averages smooth over exactly the moments where a supervisor's intervention matters most. Short-interval metrics are deliberately spiky. You want to see the bad Wednesday.
The second problem with reports as operational tools: they're backward-looking by design. Queue depth and days-on-hand are leading indicators — they tell you about problems that haven't fully landed yet. A report tells you about problems that already cost you.
The two metrics that earn a spot on almost every board
You can track thirty things. On a rolling workboard you get maybe three before people stop reading it. Two of them are nearly universal across labs.
Eliminate lab bottlenecks and errors.
Labioly helps you monitor, manage, and report lab activities efficiently and compliantly.
- Real-time sample tracking
- Inventory and supply alerts
- Staff workflow coordination
No credit card required
Queue depth (per workstation, not lab-wide)
Queue depth is the count of items waiting at a specific step — samples awaiting extraction, plates awaiting read, cases awaiting sign-out. The critical word is per workstation. A lab-wide backlog number is useless because you can't act on it. "We have 90 items in progress" tells you nothing. "The PCR setup bench has 34 waiting and normal is 12" tells you exactly where to send help.
The insight most labs miss: queue depth should be measured against that station's normal working range, not against zero. Every station carries a healthy buffer. Zero queue often means you're overstaffed there. The signal is the deviation, not the raw count.
Critical reagent days-on-hand (DOH)
DOH is current quantity divided by recent daily consumption. For your handful of genuinely critical, hard-to-source reagents, this belongs on the daily board. Not all reagents — just the ones where a stockout stops runs and lead time is long enough that you can't recover in a day.
The mistake here is tracking DOH across the full catalog. You end up with a wall of green and stop reading it. Pick the five to eight reagents that would actually halt production. A typical example: a specialty enzyme with a two-week lead time and no substitute. That earns a daily line. Standard pipette tips do not.
Where the numbers actually come from
A workboard dies when the numbers are stale or someone has to compute them by hand each morning. Wiring the data sources is the unglamorous part that decides whether this survives past week three.
| Metric | Primary source | Fallback source | Refresh cadence |
|---|---|---|---|
| Queue depth per station | LIMS status/state field | Bench sign-in sheet or ELN task list | Live or hourly |
| Critical reagent DOH | Inventory system quantity | Manual cycle count | Daily AM |
| Daily consumption (for DOH) | Reagent logging / lot usage | Protocol-based estimate | Rolling 7-day |
| Instrument availability | Instrument status log | Whiteboard "down" flags | Live |
Two practical notes from watching these get built.
First, queue depth depends entirely on how clean your LIMS state map is. If samples sit in ambiguous statuses — "in progress" meaning four different physical things — your queue counts are garbage. Fixing the state definitions comes before the board, not after.
Second, DOH is only as good as your consumption figure, and consumption is where inventory drifts. If your logged quantity and physical quantity don't match, your DOH lies to you and you'll either panic-order or stock out. The disciplined approach to keeping those aligned is its own topic, handled in the walkthrough on cycle-count reconciliation and tolerance thresholds. Get that habit in place and the DOH line on your board becomes trustworthy.
Setting thresholds that trigger action, not anxiety
A number on a board does nothing until it's tied to a threshold, and a threshold does nothing until it's tied to an action. Three tiers is enough. More than three and people freeze.
-
Green — within normal range, keep moving.
-
Amber — above normal, watch it and pre-stage a response. Nobody scrambles yet, but you decide who would help if it hits red.
-
Red — act now. A specific action card fires.
Calibrate amber and red lines from your own recent station history rather than a textbook bench mark.
The hard part is picking the amber and red lines, and the honest answer is you calibrate them from your own recent history, not from a textbook. Pull the last four to six weeks of a station's queue depth. The 75th percentile of a normal week is a reasonable amber. The point where turnaround historically started slipping is your red.
A worked example for queue depth at an extraction bench that normally sits around 10–14 samples:
-
Green
0–18
-
Amber
19–28
-
Red
29+
For DOH on a critical enzyme with a 14-day lead time:
-
Green
above 21 days
-
Amber
10–21 days (place the reorder somewhere in this band, not later)
-
Red
under 10 days — you're inside lead time and need to expedite or borrow
Notice the DOH amber line sits above lead time, not at it. If your reorder trigger equals your lead time, you're ordering at the exact moment you can no longer afford a delay. Buffer the trigger above lead time or you'll live in red.
Action cards: the part everyone skips
This is where most workboards fall apart. The board goes red, everyone looks at it, and nothing standardized happens because the response lives in one senior person's head. When that person is on vacation, red means "wait until they're back."
An action card is a short, pre-written response attached to each red condition. It answers three things: who does what, within what window, and who gets told. Keep it to a few lines — it's an index card, not an SOP.
> Trigger: Extraction bench queue ≥ 29 > Immediate action: Shift-lead reassigns one tech from prep bench for a 2-hour clearing block. > If still red after 2 hrs: Escalate to lab manager; consider overtime authorization or deferring non-urgent projects. > Notify: Post in team channel; log the reassignment.
> Trigger: Critical enzyme DOH < 10 days > Immediate action: Procurement places expedite order same day. > Bridge: Check whether a neighboring lab or core facility can lend a vial. > Notify: PI whose runs depend on it, so scheduling can flex if needed. > Log: Record the shortfall cause — was it a consumption spike or a missed reorder?
That last logging line matters more than it looks. Red events are your best diagnostic data. If the enzyme keeps hitting red, the amber threshold is probably wrong or consumption shifted and your reorder point is stale.
Building the one-week rolling view
The "rolling week" structure is what makes this operational rather than a snapshot. You keep seven days visible so patterns show up — the Wednesday spike, the Friday reagent dip — but you're always acting on today's column.
-
Pick the stations and reagents. Two to four stations, five to eight critical reagents. Resist adding more. A crowded board stops getting read.
-
Define clean states. Make sure each queue maps to one unambiguous LIMS status. Ambiguous states break the counts.
-
Wire the sources. Automate the pull where you can so nobody hand-computes at 7am. Even a scheduled query into a shared sheet beats manual tallying.
-
Set thresholds from your own data. Use recent history for amber/red. Write them down; don't leave them implicit.
-
Write the action cards. One per red condition. Short. Assign the role, not the person.
-
Place the board where people already stand. Physical board near the bench or a screen at the entrance. A dashboard nobody walks past is just another report.
-
Run a 60-second standup against it. Read today's column, note any amber, execute any red cards. Done.
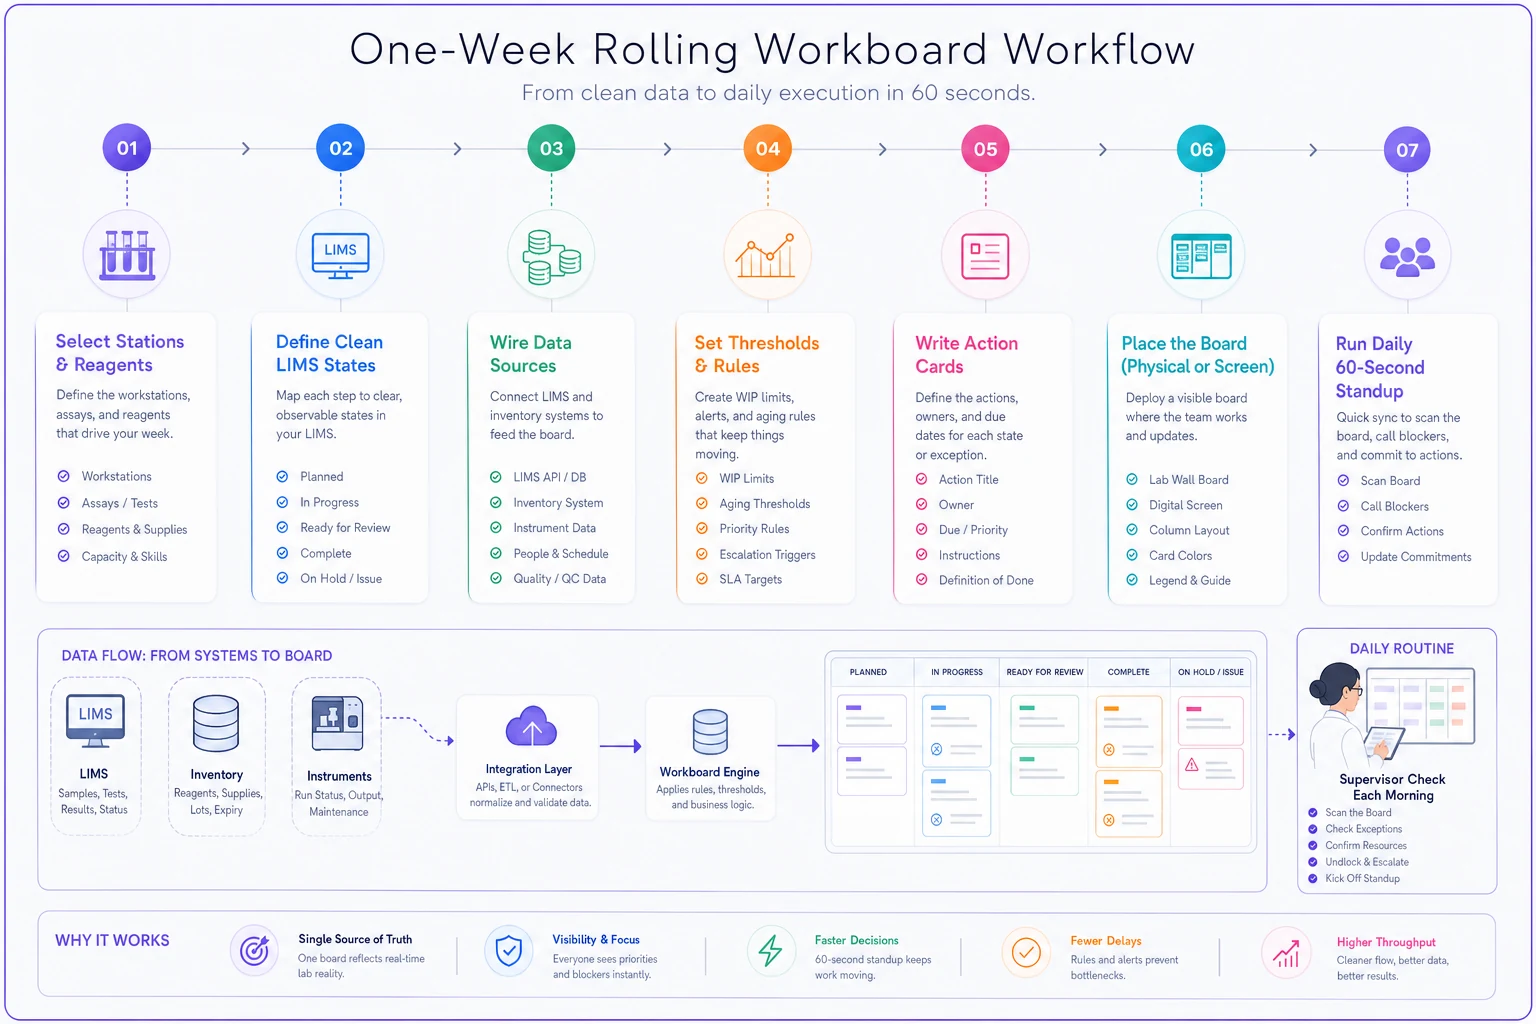
The whole daily ritual for a daily workboard lab supervisor routine should take one to two minutes. If it takes ten, you've overbuilt it and it won't survive a busy week.
A real scenario
A small clinical-research lab running extraction and qPCR was missing its 48-hour turnaround target roughly once or twice a week, without a clear cause. Their weekly average looked fine — around 1.9 days against a 2-day target — which is exactly why the misses kept surprising them.
They put up a rolling week board with three lines: extraction queue, qPCR queue, and DOH on two critical reagents. Thresholds came from six weeks of their own history. Within the first two weeks the pattern was obvious: the qPCR queue reliably went amber on Thursday afternoons because two projects submitted in bulk late in the week and the bench couldn't absorb both.
The fix wasn't heroic. They added a small Thursday-afternoon clearing block and asked one project to stagger submissions. Turnaround misses dropped noticeably, and the ones that remained now had a logged cause instead of a shrug. Nothing about the underlying capacity changed — they just started seeing the spike on the day it happened instead of in the following week's slide deck.
When a daily workboard makes sense — and when it doesn't
This works best in labs with steady, repeatable throughput and a few genuine chokepoints. Clinical, high-volume testing, and production-style research operations get the most out of it.
It's a bad fit for a purely exploratory research group where every week's work looks different and there's no stable "normal" queue to measure against. If your workflow changes shape weekly, your thresholds never stabilize and the board becomes noise.
It's also premature if your underlying data is dirty. If LIMS statuses are ambiguous and inventory counts drift, don't build the board yet — you'll be acting on fiction. Clean the state map and tighten your cycle-count discipline first, then the board has something real to display.
And honestly, it's overkill for a two-person lab where everyone already knows the queue by looking at the bench. The board earns its keep when the person responsible can't see every workstation at a glance.
The point of the whole thing
A workboard isn't about measuring more. It's about compressing the distance between a problem appearing and someone acting on it. Averages and monthly reports have their place, but they're the wrong tool for the daily decision of "where do I send help this morning."
Pick two or three metrics that lead rather than lag. Set thresholds from your own history, not a benchmark you read somewhere. Attach a short action card to every red condition so the response doesn't depend on one person's memory. Put it where people stand and keep the daily read under two minutes. That's the entire discipline — and it catches the bad Wednesday while you can still do something about it.
Ready to upgrade your lab operations?
Join 500+ labs using Labioly to save time, reduce errors, and enhance productivity and compliance.