
Three weeks into a CAP inspection, a molecular diagnostics lab in Denver found out their entire preventive maintenance program was fundamentally broken. Not because they weren't doing PM—they had meticulous records showing monthly maintenance on their qPCR instruments, quarterly checks on liquid handlers, and annual services for mass specs. The problem was deeper: none of their PM activities linked to actual performance outcomes, and when auditors asked for evidence showing how maintenance affected QC results, they had nothing.
This disconnect between maintenance activities and operational performance is more common than it should be. Labs execute preventive maintenance like a compliance checkbox rather than an operational control. The instrument preventive maintenance SOP lab teams actually need isn't about scheduling tasks—it's about creating verifiable connections between what you maintain and how instruments perform.
Why Traditional PM Programs Create Audit Vulnerabilities
Most labs inherit their PM structure from equipment manufacturers. You get a manual that says "clean the optical path monthly" or "replace seals every 500 cycles," and that becomes your PM schedule. Manufacturer recommendations become gospel, copied into SOPs without anyone really questioning whether they fit the actual usage patterns or performance requirements of that specific lab.
Manufacturer PM schedules are designed for average use cases under ideal conditions. Your thermal cycler running COVID tests 24/7 has different maintenance needs than one running research protocols twice a week. Your liquid handler processing viscous samples needs different attention than one handling aqueous solutions.
The real problem surfaces during audits. When an inspector asks "How do you know this PM frequency is appropriate for your operation?" labs scramble. They point to manufacturer recommendations but can't demonstrate why those intervals work for their specific workflows. Worse, when QC failures happen, there's no systematic way to trace whether maintenance activities actually prevent or predict problems.
A clinical chemistry lab running high-volume diabetes panels learned this the hard way. Their analyzers got manufacturer-recommended PM every 30 days. But their QC data showed drift patterns starting around day 22–25 of each cycle. By the time scheduled PM arrived, they'd already processed hundreds of borderline samples. The maintenance was happening, but it wasn't preventing quality issues.
Building PM Checklists That Actually Prevent Problems
Effective PM starts with understanding failure modes specific to your operation. Every instrument class has characteristic ways it degrades based on sample types, throughput, and environmental conditions. Generic checklists miss these patterns entirely.
Eliminate lab bottlenecks and errors.
Labioly helps you monitor, manage, and report lab activities efficiently and compliantly.
- Real-time sample tracking
- Inventory and supply alerts
- Staff workflow coordination
No credit card required
For PCR instruments, the critical maintenance points aren't just about the heating block—they're about condensation patterns specific to your lab's humidity. A research lab in Houston needs different condensation management than one in Phoenix. Your PM checklist should reflect local realities, not universal assumptions.
Liquid Handlers Standard PM focuses on tip alignment and syringe seals. But labs processing whole blood need additional checks for protein buildup in aspiration lines. Those running DMSO-based compound libraries need special attention to o-ring compatibility. Your checklist should include sample-type-specific inspection points:
-
Protein residue checks for biological samples
-
Seal swelling indicators for organic solvents
-
Carryover testing specific to your highest-risk analytes
-
Volume verification at your actual working ranges, not just manufacturer test volumes
Mass Spectrometers Traditional PM schedules cleaning based on injection count. But a proteomics lab running digested samples needs different cleaning frequency than a toxicology lab running extracted urine. Your maintenance triggers should be based on total ion current degradation and peak shape metrics from your specific methods, not arbitrary sample counts.
Automated Analyzers Most labs follow manufacturer probe cleaning schedules religiously. But probe contamination depends entirely on your sample matrix. Serum samples create different buildup patterns than plasma. Pediatric samples with smaller volumes create different carryover risks than adult samples. Your PM needs matrix-specific verification.
The checklist itself needs structure that captures both the task and the acceptance criteria. Instead of "clean probe," specify "clean probe until baseline absorbance reads below 0.002 AU with system water." Every maintenance task needs a measurable endpoint.
Calendar Cadence Based on Actual Performance Data
Static PM schedules—monthly, quarterly, annually—ignore how instruments actually degrade. A sequencer running at 20% capacity doesn't need the same maintenance frequency as one running at 90%. But most labs apply the same calendar regardless of usage.
Smart PM scheduling uses performance indicators to trigger maintenance. This doesn't mean waiting for failures—it means identifying leading indicators that predict when maintenance will actually matter. A microbiology lab tracking colony counts noticed their automated plating system showed position-dependent variation about 10 days before mechanical issues appeared. They shifted from calendar-based PM to performance-triggered maintenance when coefficient of variation exceeded 8%.
Creating these triggers requires historical analysis. Pull your QC data, instrument logs, and service records for the past year. Map when performance started degrading relative to when maintenance occurred. Patterns usually emerge:
-
Certain failure modes appear after specific cycle counts
-
Environmental changes (season shifts) accelerate certain degradation
-
Specific sample types cause faster deterioration
For a genetics lab running fragment analysis, this revealed their capillary arrays degraded predictably after around 400 injections of their specific sample types—not the 500 injections suggested by the manufacturer. They adjusted their PM trigger accordingly and eliminated late-stage resolution problems.
You still need calendar backstops, though. Even if performance indicators look fine, certain maintenance can't wait indefinitely. Set maximum intervals based on critical component lifecycles—pump seals, light sources, filters that degrade even without heavy use.
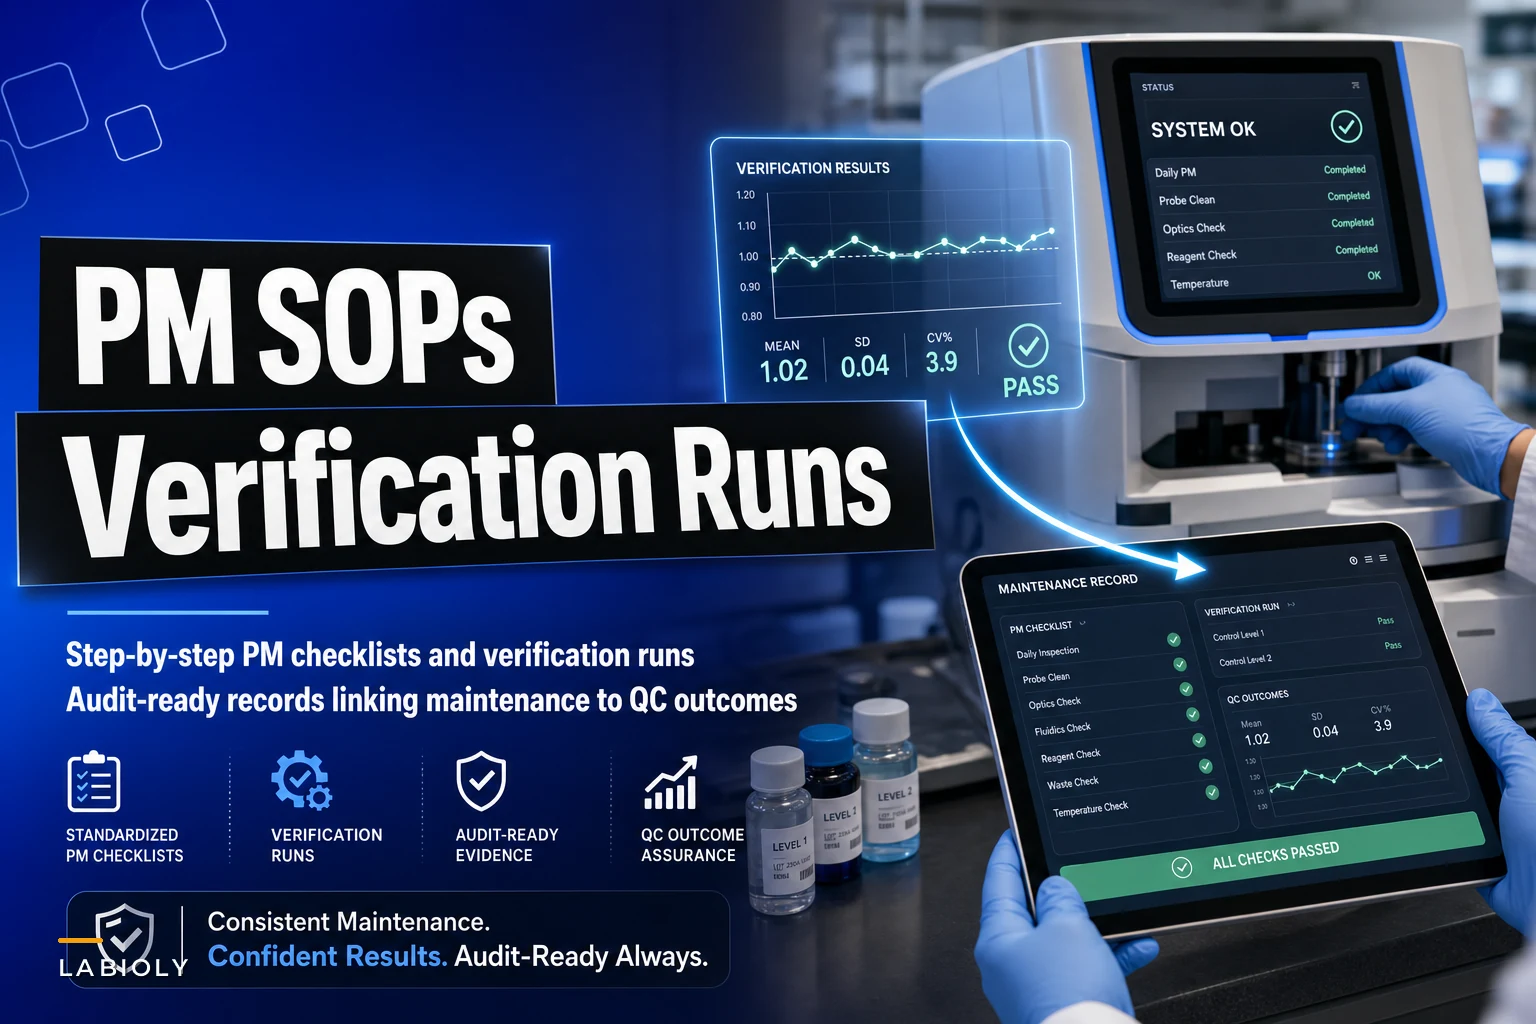
Verification Runs: The Missing Link in PM Programs
The most overlooked part of instrument PM is verification that maintenance actually worked. Labs complete PM tasks, check boxes on forms, then immediately return instruments to service. When problems appear days later, there's no way to determine if maintenance was ineffective or if a new issue emerged afterward.
Every PM event needs an associated verification run before the instrument goes back to sample processing. This isn't the same as QC—it's specifically testing whether maintenance achieved its intended outcome.
After cleaning a liquid handler, run a precision study at volumes relevant to your methods. Not just the manufacturer's test volume of 100 μL—test at 2 μL if that's what your assays actually use. After replacing a detector lamp, verify signal-to-noise ratios meet specifications across your analytical range, not just at one test wavelength.
These verification runs need acceptance criteria defined in advance. Automated QC reporting helps here, but the key is linking specific maintenance tasks to specific performance metrics:
-
Probe cleaning → carryover below 0.01%
-
Optical path cleaning → baseline noise below method specifications
-
Temperature calibration → uniformity within 0.5°C across all positions
-
Flow cell maintenance → pressure readings within 5% of baseline
When verification fails, you need escalation procedures. A toxicology lab found that roughly 15% of their PM events required additional maintenance to pass verification. They built this into their scheduling, blocking extra time for complex PM tasks that historically needed a second pass.
Schedule verification runs during low-throughput windows so you can block time for rework without impacting sample turnaround.
The verification run isn't just about catching problems. It also gives you a clean performance snapshot tied to a specific maintenance event, which becomes genuinely useful evidence when auditors ask whether your PM program is working.
This workflow outlines the steps from performing PM to running verification and recording audit-ready evidence.
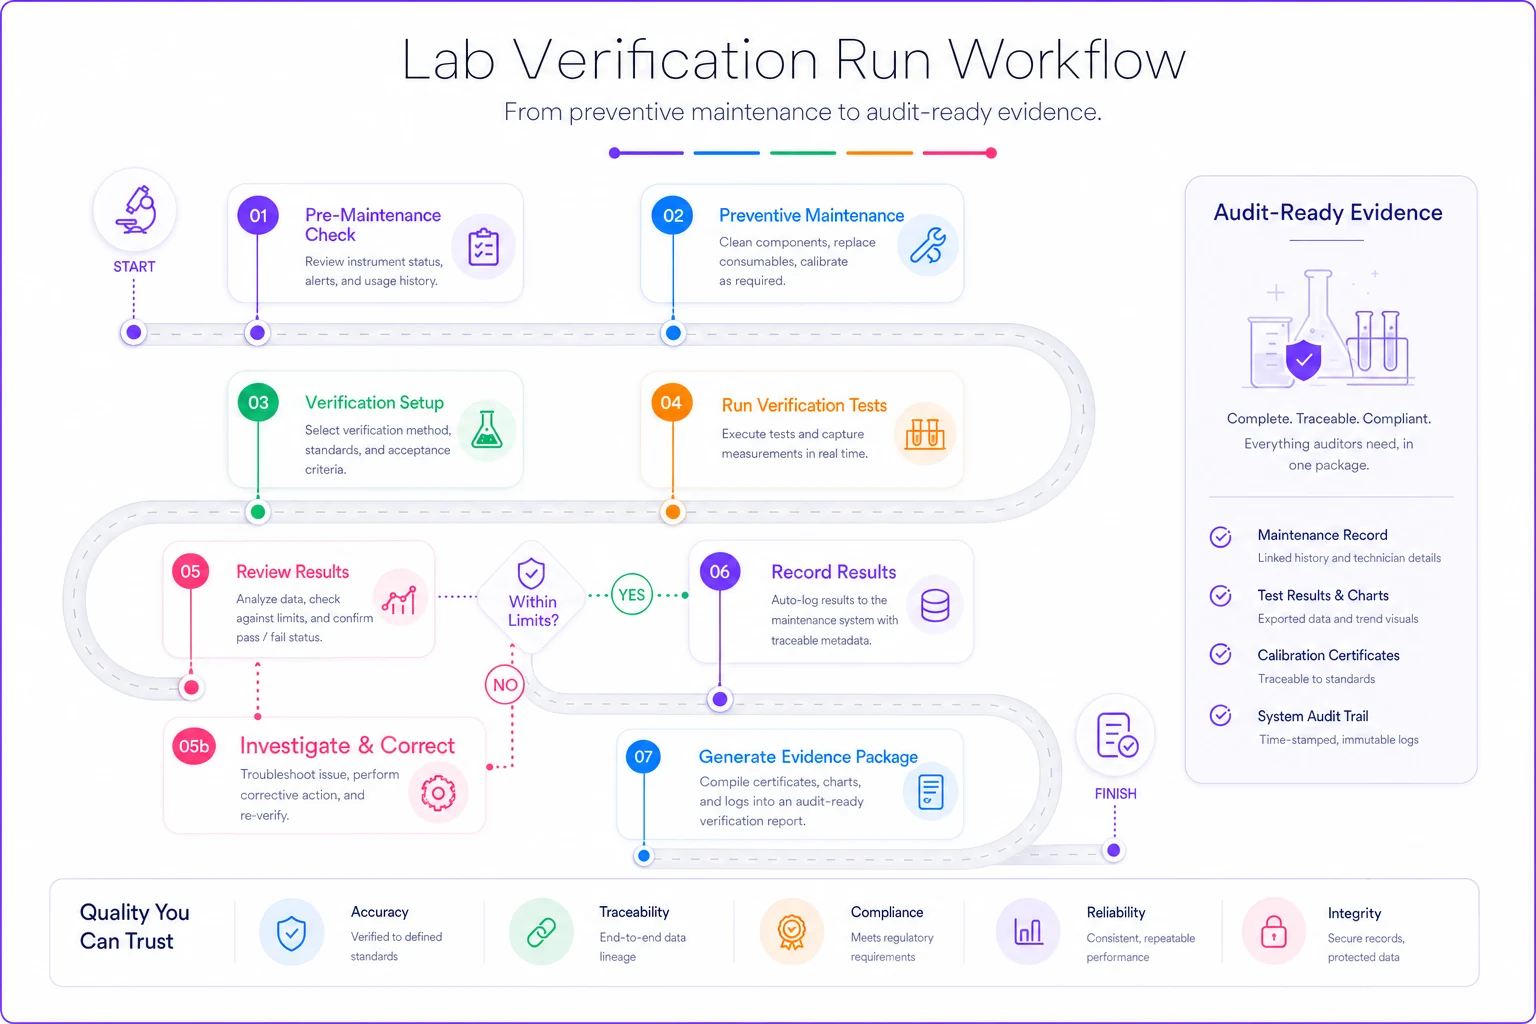
When verification shows maintenance improved or stabilized performance, that paired record becomes a powerful part of your audit package.
Documentation Templates That Connect PM to QC Outcomes
The audit-ready evidence package for PM isn't just maintenance records—it's demonstrable links between maintenance activities and quality outcomes. Most labs can show they did PM. Few can show that PM made a difference.
Your documentation needs three linked components:
Pre-PM Performance Baseline Before starting maintenance, document current performance state. Pull the last week of QC data, note any trending, capture current instrument parameters. This becomes your comparison point for proving maintenance effectiveness.
PM Execution Records Beyond simple checklists, capture quantitative observations during maintenance. Instead of "cleaned probe," record "removed visible protein residue, approximately 2mm buildup on aspiration side." These details matter when investigating future issues.
Post-PM Performance Verification Document that performance improved or stayed stable after maintenance. This isn't just pass/fail—show numerical comparisons. "Baseline noise reduced from 0.8 mAU to 0.3 mAU" proves your maintenance had measurable impact.
A pharmaceutical QC lab created templates that automatically pulled this data together. Their PM reports included:
-
QC trend charts for 30 days before and after PM
-
Instrument performance metrics (S/N ratios, resolution, peak symmetry)
-
Service event correlation showing reduced emergency calls after PM optimization
-
Cost analysis comparing PM investment to prevented downtime
The template structure matters less than the connections it reveals. Auditors want to see that you understand how maintenance affects quality, not just that you follow schedules.
Creating Audit Trails Between Maintenance and Performance
Modern audits expect sophisticated connections between all operational elements. Doing PM and running QC separately isn't enough—you need demonstrable relationships between maintenance inputs and quality outputs.
This requires intentional data structure. Your PM records need unique identifiers that connect to instrument data capture systems. When QC fails three days after PM, you should be able to immediately query whether specific maintenance tasks were completed successfully.
A molecular lab built these connections using simple naming conventions. Every PM event got a unique ID (PM-INS001-2024-0312) that techs entered into instrument software during verification runs. Later analysis could directly link QC performance to specific maintenance events.
-
Forward
Did PM prevent expected problems?
-
Backward
When problems occur, was PM completed properly?
The backward correlation is where you find gaps. A clinical lab discovered their centrifuge imbalance issues always occurred 45–50 days after rotor inspection, despite quarterly PM schedules. They added a 45-day visual check that caught developing problems before they affected samples.
Risk-Based PM Frequency Adjustments
Not all instruments carry equal risk. Your backup thermocycler running overflow samples needs different PM rigor than your primary sequencer processing stat samples. Risk-based PM means adjusting frequency and depth based on operational impact.
Three risk factors worth considering:
Sample criticality: Instruments processing irreplaceable samples or stat tests need more frequent PM regardless of performance indicators. A research lab running precious patient biopsies schedules PM based on zero-failure tolerance, not optimal efficiency.
Redundancy availability: Single points of failure in your workflow need conservative PM schedules. If you have three identical analyzers, you can stretch PM intervals on individual instruments. With one analyzer, you can't afford unexpected downtime.
Recovery complexity: Some instruments take days to fully recover after major PM. A mass spectrometer might need 48 hours of conditioning after source cleaning. These instruments need PM scheduled around operational valleys, regardless of performance triggers.
Map your instruments into risk tiers:
| Risk Tier | Redundancy | PM Trigger Threshold |
|---|---|---|
| Critical / No backup | None | 75% of failure threshold |
| Important / Limited backup | Partial | 85% of failure threshold |
| Routine / Full redundancy | Full | 95% of failure threshold |
A genetics testing lab applied this model and reduced total PM hours by about 30% while actually improving uptime. They shifted effort away from over-maintaining redundant equipment and toward protecting critical-path instruments. That reallocation alone changed how their team thought about scheduling.
Building Your PM Program With Operational Data
The path to effective PM isn't about following more checklists—it's about understanding your specific operational patterns. Start by analyzing your actual failure modes, not theoretical ones.
Pull your service records for the past two years. Categorize every breakdown, every QC failure that traced to equipment, every unexpected shutdown. Look for patterns:
-
Pull service records quarterly and tag each event as scheduled PM, unscheduled repair, or QC-triggered intervention
-
Calculate time between last PM event and each unscheduled service call per instrument
-
Review QC pass rates in the 30 days following PM for each instrument class
-
Flag PM events that required re-work before passing verification
-
Adjust PM intervals up or down based on what the data actually shows
A proteomics core facility found that roughly 60% of their instrument issues traced back to five specific failure modes across all instruments. They restructured their entire PM program around preventing those five issues and largely ignored manufacturer recommendations for components that never actually failed in their operation.
Your PM program becomes self-improving when you track the right metrics. Here's a straightforward process for reviewing PM effectiveness on a rolling basis:
Moving Beyond Compliance-Driven Maintenance
The fundamental shift in thinking about instrument preventive maintenance isn't about doing more—it's about proving what you do matters. Every PM activity should have a measurable impact on instrument performance. Every schedule should be justified by operational data. Every verification should link to quality outcomes.
This approach initially takes more effort than copying manufacturer recommendations into an SOP. But it pays off through reduced downtime, better audit outcomes, and lower total maintenance costs.
Your instrument preventive maintenance SOP for the lab shouldn't be a static document. It should evolve as you collect more data about what actually prevents problems in your specific environment. Over time, your PM program gets more targeted, not more burdensome.
The labs that excel at PM aren't the ones with the most detailed checklists. They're the ones who understand exactly why each maintenance task matters for their specific operation and can prove it with data. When auditors ask "How do you know your PM program is effective?" these labs don't point to schedules—they show performance data that demonstrates a clear relationship between maintenance activities and operational outcomes.
Ready to upgrade your lab operations?
Join 500+ labs using Labioly to save time, reduce errors, and enhance productivity and compliance.