

Most small labs can tell you their annual reagent spend. Very few can tell you what a single qPCR run actually costs once you fold in the tech's time, the thermocycler's depreciation, the pipette tips that never make it onto a requisition, and the freezer's share of the electricity bill. That gap — between knowing your budget and knowing your unit economics — is where most cost decisions go sideways.
When a PI asks "can we afford another 200 samples this quarter," or a core facility needs to set a chargeback rate, or you're deciding whether to buy a benchtop sequencer versus keep outsourcing, you need a per-experiment cost that holds up under scrutiny. Guessing produces two failure modes: you either under-price and bleed the budget slowly, or you over-price and lose internal customers to outside vendors. Both are avoidable with a spreadsheet and a couple of afternoons.
This is a build guide. We'll construct the cost model layer by layer, show worked numbers, hand you chargeback templates you can adapt, and lay out the specific triggers that tell you when a purchase decision has actually flipped.
Why per-experiment cost is so hard to pin down
The trouble starts with how lab spending gets recorded. Consumables get booked against grants or cost centers in big lumps — a $4,200 order of master mix here, a $900 tip restock there. Instrument time shows up nowhere in the accounting because it's a sunk asset. Labor is buried in salary lines that don't map to any single experiment. The raw data exists, but it's scattered across three systems that were never designed to talk to each other.
Then there's allocation. A box of tips gets used across a dozen protocols. A centrifuge serves the whole floor. How much of the freezer's running cost belongs to sample set A versus sample set B? There's no single right answer, which is exactly why people avoid the question. But "no perfect answer" doesn't mean "no useful answer." A reasonable, consistent allocation rule beats a precise one you can't maintain.
What tends to happen in small labs is that the cost model doesn't fail because the math is hard — it fails because nobody owns the assumptions. Someone builds a solid spreadsheet, then leaves, and the reagent prices haven't been updated in two years. The model becomes a museum piece. So before touching a single formula, decide who updates the inputs and how often. That decision matters more than any calculation below.
The four cost buckets, and where each one hides
Every per-experiment cost breaks down into four buckets. Keep them separate — mixing them is the fastest way to lose trust in your own numbers.
Eliminate lab bottlenecks and errors.
Labioly helps you monitor, manage, and report lab activities efficiently and compliantly.
- Real-time sample tracking
- Inventory and supply alerts
- Staff workflow coordination
No credit card required
Consumables. Direct materials consumed by the experiment: reagents, kits, tips, plates, tubes. The trap is the invisible consumables — gloves, ethanol, the pipette tips grabbed by the fistful that never touch a requisition. These "shop supplies" can run 8–15% on top of your named reagents, and if you ignore them your cost is optimistically wrong.
Instrument time. The share of an instrument's total cost of ownership attributable to a given run. That means depreciation plus service contract plus consumable parts (columns, flow cells, lamps) plus energy draw. Most labs skip this entirely because the instrument is "already paid for." A service contract alone on a mass spec can run $18k–$30k a year, and that cost has to land somewhere.
Labor. Hands-on and hands-off tech time. Hands-on is obvious. Hands-off — the 90-minute incubation where someone still has to be around to catch a failure — is where estimates get sloppy. Fully-loaded labor (salary plus benefits plus employer taxes) usually runs 1.3–1.4× base wage. Using base wage understates labor cost by roughly a third.
Overhead. Everything that keeps the lights on but can't be traced to one experiment: facility rent, shared software, admin, quality and compliance time, utilities not captured under instruments. This gets allocated, not measured.
| Bucket | Typical driver | Common mistake | Rough share of total |
|---|---|---|---|
| Consumables | Per-run bill of materials | Ignoring untracked shop supplies | 30–50% |
| Instrument time | Hours × loaded hourly rate | Treating paid-off gear as free | 10–25% |
| Labor | Loaded wage × total time | Using base instead of loaded wage | 20–40% |
| Overhead | Allocated per run or per hour | Double-counting utilities | 10–20% |
The shares vary a lot by lab type. A high-throughput genomics core is consumables-heavy; a specialized assay-development group skews toward labor. Don't anchor to these percentages — build your own from your actual numbers.
Building the spreadsheet, layer by layer
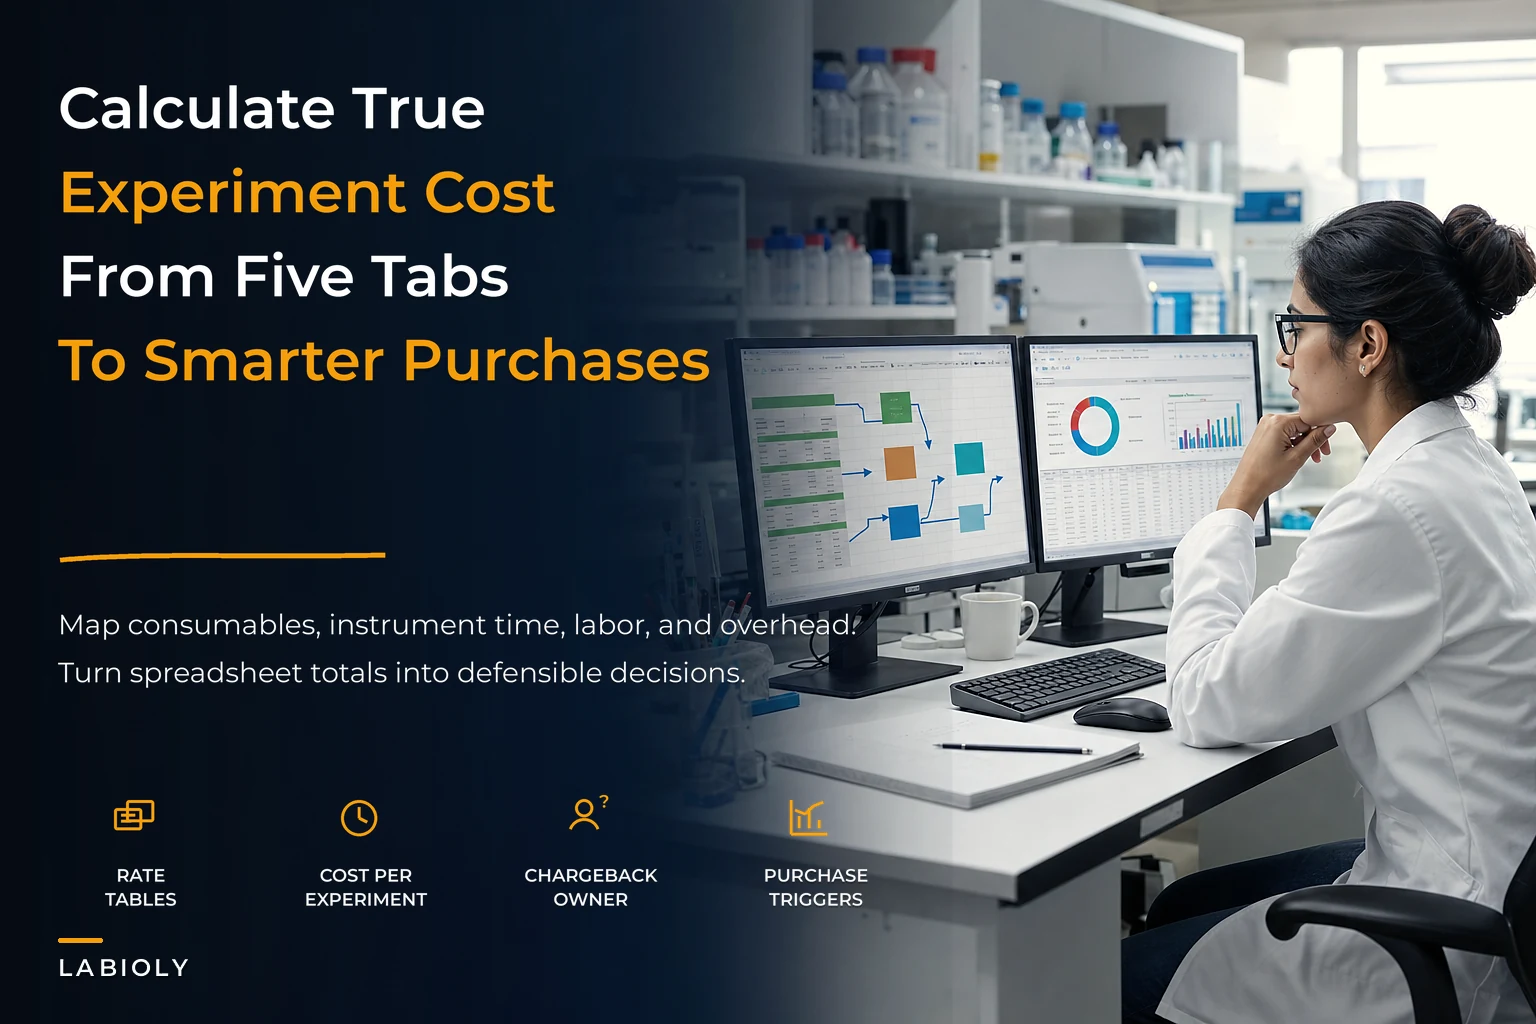
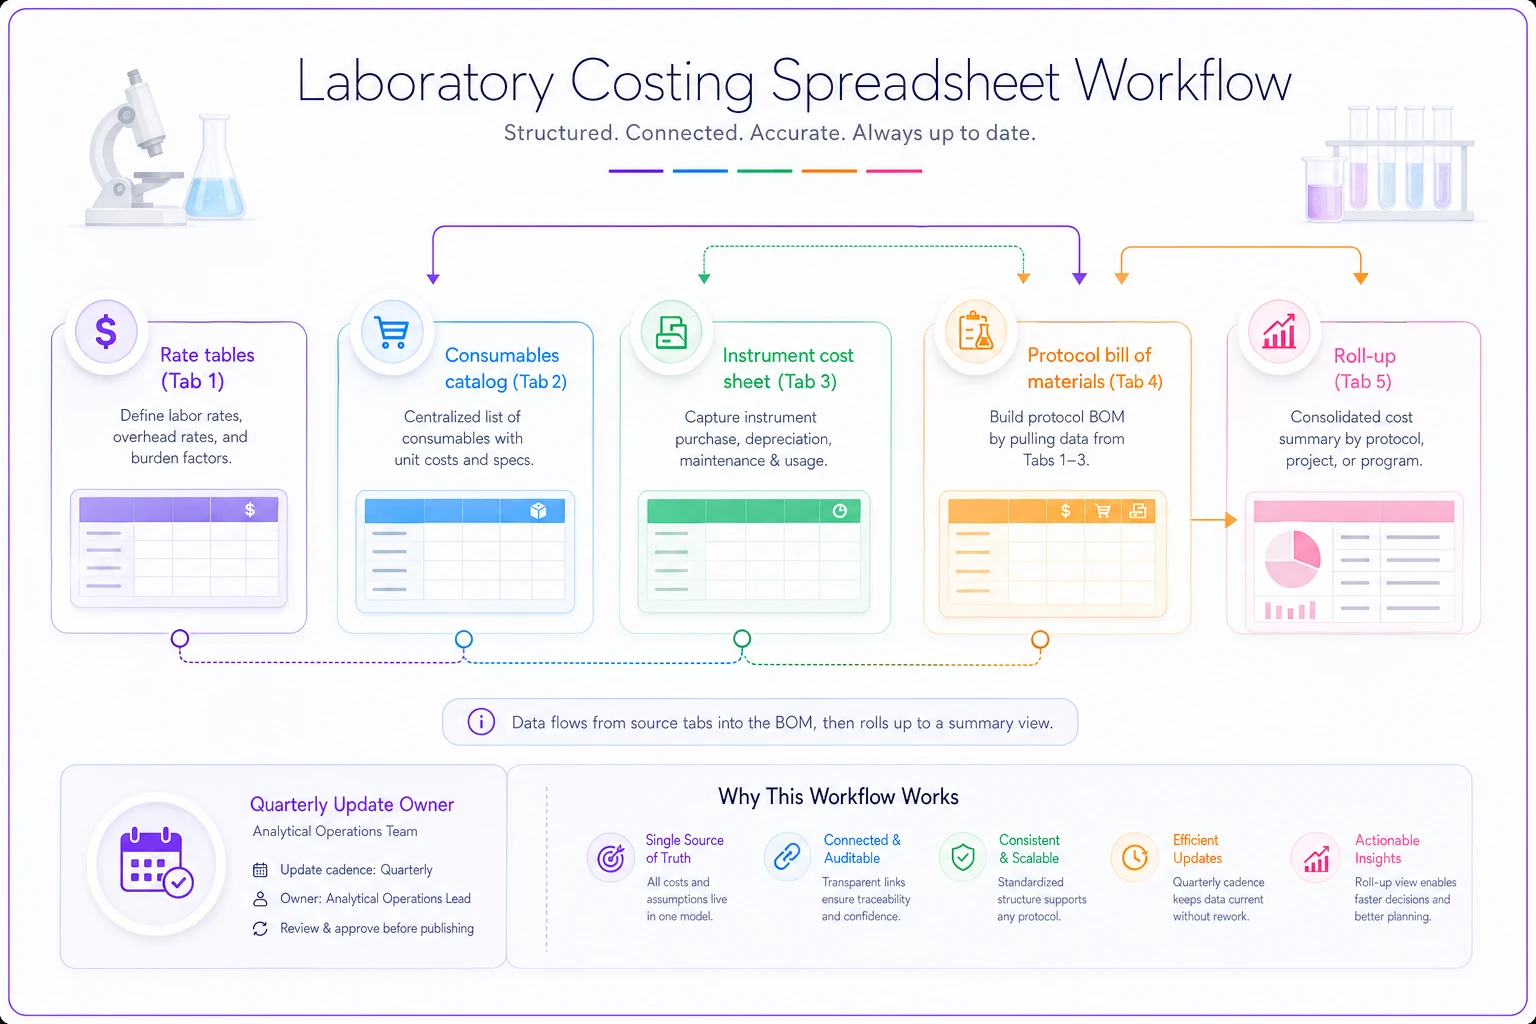
The construction order below keeps the model auditable. Each layer sits on its own tab so you can update inputs without breaking the calculation.
-
Rate tables (Tab 1). Static-ish inputs you update quarterly
loaded hourly wage by role, instrument hourly rates, overhead rate. This is your single source of truth — everything else references it.
-
Consumables catalog (Tab 2). Every reagent and consumable with current unit price, pack size, and cost-per-unit. Pull prices from your actual last-paid invoices, not catalog list price — the two differ, sometimes significantly, once contract discounts apply. If you've done work on vendor governance and supply scorecards, your negotiated pricing lives here.
-
Instrument cost sheet (Tab 3). For each instrument
purchase price, useful life in years, annual service contract, annual consumable parts, estimated annual run-hours. From these you derive a loaded hourly rate.
-
Protocol bill of materials (Tab 4). For each experiment type, list every consumable line with quantity used, tech time in hours by role, and instrument-hours. This is the heart of the model.
-
Roll-up (Tab 5). The per-experiment total, pulling quantities from Tab 4 and prices/rates from Tabs 1–3, then adding the shop-supply uplift and overhead allocation.
The discipline that makes this survive is separating quantities (which live in the protocol) from prices (which live in rate tables). When master mix goes up 12%, you change one cell and every affected protocol updates. Labs that hard-code prices into each protocol row end up with dozens of stale numbers and no idea which ones are current.
Assign a single owner for rate-table updates and make quarterly reminders non-optional.
A simple visual clarifies the tab-to-tab data flow.
Deriving the instrument hourly rate
-
Purchase price
$32,000, useful life 7 years → $4,571/year depreciation
-
Service contract
$3,800/year
-
Consumable parts and calibration
~$600/year
-
Estimated usage
about 900 run-hours a year
Annual cost of ownership: $4,571 + $3,800 + $600 = $8,971. Divide by 900 hours → roughly $10/instrument-hour. That feels small, and that's the point — it's small per run but real at scale. A run that ties up the machine for 2 hours carries about $20 of instrument cost that would otherwise disappear into nothing.
The bigger sensitivity is utilization. If that machine only runs 400 hours a year instead of 900, the hourly rate more than doubles to around $22. Underused instruments are expensive per experiment — and surfacing that signal is exactly the point. It's the same logic behind tracking operational rather than vanity metrics. Idle expensive gear is a cost, not a convenience.
A fully worked example: one qPCR experiment
Let's cost a single 384-well qPCR run, start to finish. Small assay-validation lab, one tech running it.
-
Consumables
-
384-well plate + optical seal
$8.50
-
Master mix (one plate's worth)
$46.00
-
Primers/probes (amortized per run)
$22.00
-
Template prep reagents
$15.50
-
Tips, tubes, misc named
$6.00
-
Subtotal named consumables
$98.00
-
Shop-supply uplift at 10%
$9.80
-
Consumables total
$107.80
-
Instrument time
-
qPCR run time
2.0 hours × $10/hr = $20.00
-
Prep on a shared centrifuge/plate spinner
0.3 hr × $4/hr = $1.20
-
Instrument total
$21.20
-
Labor
-
Hands-on prep and plate setup
1.5 hr
-
Hands-off monitoring during run
0.5 hr effective
-
Total tech time
2.0 hr × loaded wage of $38/hr = $76.00
-
Overhead
-
Allocated at $9/experiment (see allocation method below)
-
Overhead
$9.00
-
Per-experiment total
roughly $214.
Now look at the composition. Consumables sit at 50%, labor at 35%, instrument at 10%, overhead at 4%. If someone had eyeballed this run at "about a hundred bucks in reagents," they'd have undercounted by half — because they skipped labor and instrument entirely. That's the typical error, and it's the one that quietly drains a budget over a fiscal year.
Allocating overhead without overthinking it
Overhead allocation stops people cold. Keep it simple. Total your annual overhead pool — say facility charge, shared software, quality and compliance staff time, and uncaptured utilities add up to around $54,000. Divide by total annual experiment volume — say 6,000 experiments. That's $9 per experiment, flat.
Is that crude? Yes. A qPCR plate and a two-week cell culture experiment don't consume the same overhead. If that bothers you, allocate overhead per labor-hour instead — total overhead divided by total tech hours — which scales the burden with effort. Pick one method, document it, and apply it consistently. A defensible-but-imperfect rule you actually maintain beats a sophisticated one you abandon after six months.
Turning cost into chargeback rates
If you run a core facility, per-experiment cost becomes a rate you bill. The template below is the minimum you need. Full recovery means users pay the true cost; subsidized means the institution eats a share.
-
Direct consumables
$107.80
-
Instrument time
$21.20
-
Labor
$76.00
-
Overhead allocation
$9.00
-
Cost basis
$214.00
-
Institutional subsidy (if any)
–$X
-
Internal rate (subsidized)
$214 – subsidy
-
External/industry rate
cost basis × markup (often 1.5–2.5×)
Two things trip labs up here. First, mixing internal and external rates — most institutions require a documented, consistent rate schedule, and charging external users the same as internal ones can violate cost-recovery policy. Second, forgetting to rebuild the rate when inputs move. Reagent inflation of 10–15% over a year silently erodes recovery until the facility is running at a loss it can't explain.
The booking and prioritization side matters as much as the rate itself. A chargeback that's correct on paper but tied to a broken scheduling process still loses money — those failure patterns are worth reviewing separately in the context of core facility SLA and booking mistakes. A rate is only recovered if the instrument actually gets booked and the time actually gets logged.
Purchase decision triggers: when the number flips
The real payoff of a cost model is that it turns "should we buy this?" from an argument into a calculation. Below is the checklist for labs deciding between outsourcing and bringing a capability in-house.
Buy in-house — act when several of these hold:
-
Your per-experiment outsourced cost × projected annual volume exceeds the in-house all-in cost (equipment amortization + consumables + labor + service) by a meaningful margin — not 5%, more like 25%+ to cover risk.
-
Turnaround time from the outside vendor is materially delaying projects, and delay has a cost you can name.
-
Projected annual run-hours would put the new instrument above roughly 50% of the utilization assumed in its hourly-rate calculation. Below that, per-experiment cost stays punishing and the case weakens.
-
You have the labor headcount to run it without pulling people off funded work.
Keep outsourcing when:
-
Volume is lumpy or uncertain — buying a $40k instrument to run 150 experiments a year gives you a brutal per-run instrument cost.
-
The technique is outside your core competency and would carry hidden training and troubleshooting time.
-
The service contract and consumable parts blow past what the throughput justifies.
A worked trigger example: a lab outsourcing library prep at $85/sample, running about 1,400 samples a year, spends roughly $119k annually. In-house all-in — kit consumables at $38/sample, loaded labor at $22/sample, plus $14k/year amortized equipment and $6k service — comes to about $104k. That's a $15k gap, only around 13%. Below the 25% risk margin, so the honest answer is not yet — one bad year of volume erases the savings. Push volume to 2,000 samples and the in-house per-unit drops as fixed costs spread, the gap widens, and the purchase becomes clearly worth it. The model tells you when, not just whether.
When this level of costing is worth it — and when it isn't
Full per-experiment costing pays off when you run repeatable, high-volume protocols, when you charge back to users, or when you face real make-versus-buy decisions. In those situations the model directly protects the budget.
For a lab running mostly one-off exploratory experiments that never repeat, it's probably not worth the effort. You'll spend more time modeling than the insight is worth, and the numbers won't stabilize because nothing runs twice. A rough consumables estimate is fine there.
One more thing worth saying plainly: if nobody can commit to maintaining the rate tables, don't bother building this. A cost model with 18-month-old prices is worse than no model — it produces confident wrong answers. If there's no clear owner for quarterly updates, track consumables only and skip the rest until someone can actually own it.
A real scenario
A small immunoassay lab — four staff, running ELISA-based assays for internal projects and a handful of external clients — had never costed a plate. They billed external clients "about $180 a plate" based on a number someone had picked years earlier. Building the model took two afternoons.
The true cost per plate came to roughly $240 once loaded labor and the plate reader's service contract were folded in. They'd been losing about $60 on every external plate, and at around 45 external plates a month that's close to $2,700 walking out the door unnoticed every month.
They raised the external rate to $310 — a modest markup over true cost — kept the internal rate subsidized, and used the instrument hourly rate to flag that the plate reader was badly underused. That killed a pending proposal to buy a second one. Net effect over the following two quarters was a swing of several thousand dollars a month in the right direction, with no new equipment and no extra headcount. Nothing exotic happened. They just stopped guessing.
Closing thought
The per-experiment cost model isn't a finance exercise bolted onto the science — it's an operational instrument. It connects consumables spend, instrument utilization, labor allocation, and purchasing decisions into one picture, and it surfaces the quiet leaks that annual budgets hide.
Build it in a spreadsheet, keep quantities separate from prices, assign an owner to the rate tables, and revisit it quarterly. Do that, and the next time someone asks whether you can afford the extra 200 samples, you'll have an answer that holds up — instead of a shrug.
The per-experiment cost model isn't a finance exercise bolted onto the science — it's an operational instrument. It connects consumables spend, instrument utilization, labor allocation, and purchasing decisions into one picture, and it surfaces the quiet leaks that annual budgets hide.
Ready to upgrade your lab operations?
Join 500+ labs using Labioly to save time, reduce errors, and enhance productivity and compliance.