

Most lab budget fights aren't really about money. They're about the absence of a rule. Someone requests a second sequencer, the PI who shouts loudest gets it, and six months later half the labs are quietly annoyed while the instrument sits at 40% utilization. Meanwhile the mass spec that everyone actually depends on is running 18-hour days with no backup plan and no line item to fix it.
The problem isn't that labs lack data. Between LIMS logs, booking systems, and instrument counters, most facilities are drowning in it. The problem is that the data never connects to a decision. Utilization dashboards live in one world. The budget lives in another. And the bridge between them — where a number is supposed to trigger an action — is usually just someone's gut feeling in a spring planning meeting.
A real laboratory financial capacity strategy closes that gap. It ties specific metrics to explicit thresholds, thresholds to pre-agreed actions, actions to who pays, and all of it to a procurement plan that spans more than one fiscal year. When it works, budget decisions stop being political and start being boring. Boring is good. Boring means predictable.
Why the disconnect happens in almost every lab
The pattern is consistent across academic cores, small biotech operations, and hospital research labs. Each builds their financial picture in layers that were never designed to talk to each other.
Utilization gets tracked because a grant or an audit asked for it. Chargebacks get set up because finance needed cost recovery. Capital requests get made because an instrument broke or a new project landed. These three things emerge separately, at different times, driven by different people. Nobody sits down and says, "at what utilization number do we agree to buy the next one?"
So the lab ends up reactive. Capacity problems only become visible when they've already caused damage — a run delayed, a sample batch missed, a collaborator going elsewhere. By then you're making a rushed capital request with no roadmap behind it, and finance is understandably skeptical because the last three "urgent" requests also arrived with no supporting logic.
Utilization alone doesn't tell you what to do. An instrument at 85% could mean you're perfectly optimized or one flu season away from a bottleneck. Without a rule that says what happens next, the dashboard is just a wallpaper of green and yellow squares. This is the same trap covered in our piece on why labs should stop tracking vanity metrics and build an operational KPI and capacity-planning system — the metric only earns its keep when it drives a decision.
The three layers that have to connect
Before the trigger rules make sense, it helps to see the whole system as three linked layers rather than three separate spreadsheets.
Eliminate lab bottlenecks and errors.
Labioly helps you monitor, manage, and report lab activities efficiently and compliantly.
- Real-time sample tracking
- Inventory and supply alerts
- Staff workflow coordination
No credit card required
Layer one is measurement. Utilization, turnaround time, queue depth, cost-per-sample, downtime hours. These are your sensors.
Layer two is policy. The chargeback model and the trigger rules. This is where a measured number becomes either a price or an action.
Layer three is planning. The multi-year procurement roadmap that absorbs the outputs of layer two and sequences them against budget cycles, depreciation schedules, and grant timelines.
When these three run as one system, a rising utilization number automatically adjusts pricing signals, flags a capacity trigger, and updates the position of an instrument on the roadmap. When they run separately — which is the default — you get the political version of budgeting.
This diagram shows the workflow connecting the three layers and where triggers fire.
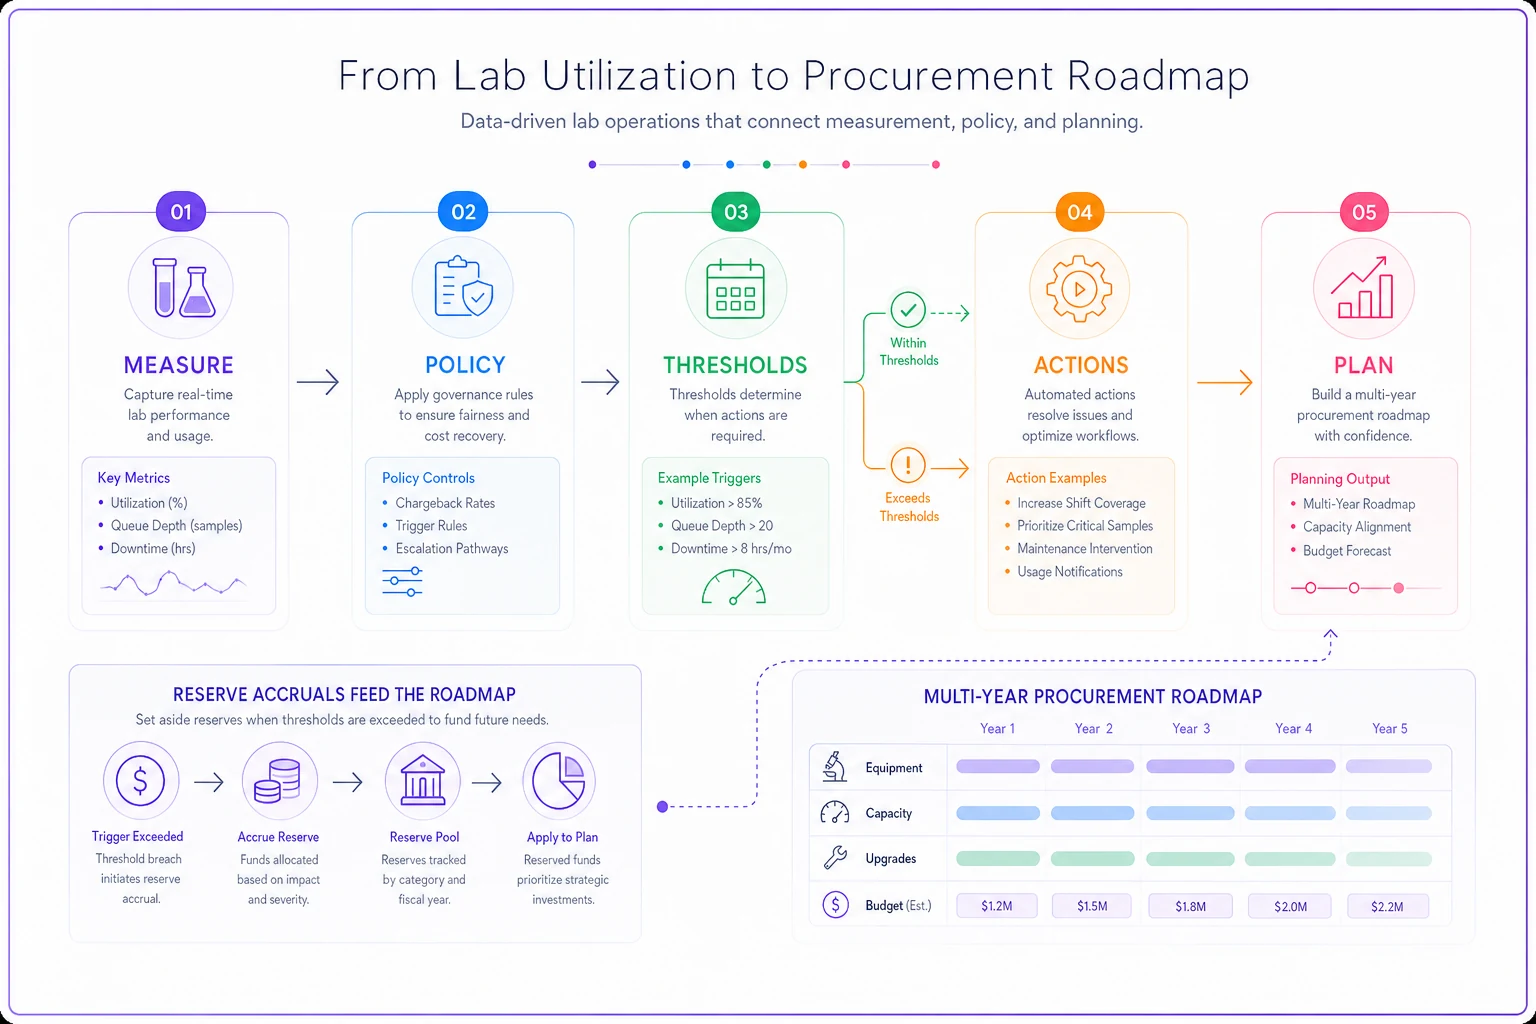
Here's how that plays out in practice. A core facility measures that its flow cytometer hit 82% utilization for three consecutive months. That crosses a policy threshold that says "above 80% for a quarter, begin a capital evaluation." The evaluation pulls in cost-recovery data from the chargeback system to model whether a second unit could be self-sustaining. That model then updates the roadmap, moving the second cytometer from "year three, maybe" to "year one, funded." No meeting required to start the process — the process started itself.
Building the trigger table
The trigger table is the heart of the whole thing. It's a simple document, but writing it forces the hard conversations before a crisis instead of during one. Each row links a metric, a threshold, a sustained duration so you don't overreact to one busy week, and an explicit action with an owner.
The sustained-duration column is the part most labs skip, and it's the part that keeps you sane. A single month at 90% is noise. Three months at 78% is a signal.
| Metric | Green | Watch | Trigger | Sustained for | Action | Owner |
|---|---|---|---|---|---|---|
| Instrument utilization | <65% | 65–79% | ≥80% | 3 months | Open capital evaluation | Facility manager |
| Sample queue (days to schedule) | <3 | 3–6 | >6 | 2 months | Add shift or outsource overflow | Ops lead |
| Cost recovery ratio | 90–105% | 80–89% | <80% | 1 quarter | Rate review | Finance liaison |
| Unplanned downtime | <2% | 2–5% | >5% | 2 months | Service contract review / backup plan | Facility manager |
| Reagent stockout events | 0 | 1 | ≥2 | 1 quarter | Forecast + safety stock revision | Procurement |
Notice that the actions aren't all "buy something." Overflow can be outsourced. A queue problem might be solved by a second shift for a fraction of a capital purchase. A cost-recovery miss triggers a rate review, not a spending request. The table's job is to match the right response to the right signal.
Treat the sustained-duration column as your noise filter — it prevents acting on one busy month.
The other quiet benefit: when a trigger fires and the owner acts, nobody can accuse them of empire-building. They followed the rule the whole facility agreed to. That removes a surprising amount of friction from lab capital politics.
Chargeback policy that actually recovers cost
Chargebacks are where good intentions go to die. Rates get set once, based on a rough estimate, and then never revisited even as reagent prices climb and instruments age into higher service costs. Two years later the facility is quietly subsidizing every run and finance can't figure out why the deficit keeps growing.
A chargeback rate needs to carry the full weight of what a service actually costs, not just the obvious consumables. The realistic components:
-
Direct consumables (reagents, plates, tips) per sample
-
Instrument time allocation — depreciation plus service contract, divided by expected annual runs
-
Labor — the fraction of a tech's time per sample, loaded with real overhead
-
Overhead allocation — facility, utilities, QC, calibration
-
A modest reserve contribution toward the next instrument
That last line is the one almost everyone leaves out, and it's the one that connects chargebacks to the roadmap. If every run contributes a few dollars toward the replacement or expansion fund, the capital request three years out is partly pre-funded and far easier to defend. Our breakdown on calculating cost-per-experiment with worked spreadsheets and chargeback templates walks through the per-run math in more detail if you're building the rate model from scratch.
A workable chargeback line for a sequencing run:
| Cost component | Per-run amount |
|---|---|
| Consumables | $118 |
| Instrument time (depreciation + service ÷ runs) | $46 |
| Labor (loaded) | $37 |
| Overhead allocation | $22 |
| Reserve contribution | $9 |
| Total recovery rate | $232 |
Set the internal rate at that number, review it quarterly against the cost-recovery trigger in the table, and the facility stops bleeding quietly. The reserve line, at $9 across a few thousand runs a year, quietly builds a meaningful down payment on the next box.
The multi-year procurement roadmap
A single-year budget can't handle instruments that cost more than a year's discretionary budget and last seven to ten years. The roadmap sequences purchases across fiscal years so that no single year gets crushed, backup capacity exists before the primary instrument fails, and depreciation and warranty expirations are anticipated instead of discovered.
The roadmap isn't a wish list. Every item on it should be tied back to a trigger metric or a known lifecycle event — a warranty ending, a service contract that jumps in year six, a projected demand curve from incoming grants. When you present it to finance, each line answers "why this, why now" before it's asked.
A sample capital-request row that links the metric to the decision:
| Item | Trigger basis | Year | Est. cost | Reserve accrued | Net request | Backup for |
|---|---|---|---|---|---|---|
| 2nd flow cytometer | Utilization ≥80%, 3 mo | Y1 | $215k | $34k | $181k | Primary cytometer |
| qPCR replacement | Warranty end + 6% downtime | Y2 | $48k | $18k | $30k | — |
| Mass spec service upgrade | Contract jump Y6 | Y3 | $72k | $27k | $45k | — |
| Backup -80 freezer | Single point of failure | Y2 | $14k | $6k | $8k | Sample storage |
The "reserve accrued" column is what ties the whole system together. Those chargeback reserve contributions from layer two show up here as real dollars that shrink the net request. A capital ask of $215k that's already $34k pre-funded lands very differently in a budget meeting than a raw six-figure number with no history behind it.
A short numbered process for standing this up
If you're starting from scratch, the sequence matters. Doing it in the wrong order leaves you with policies that don't match reality.
-
Instrument your measurement layer first. Get clean utilization, queue, and downtime numbers for at least one quarter before setting any thresholds. Thresholds based on guesses are worse than none.
-
Rebuild the chargeback model with full cost loading, including the reserve line. Confirm it against actual spend.
-
Draft the trigger table with the people who'll own the actions in the room. Argue about the thresholds now, not later.
-
Assemble the roadmap by mapping known lifecycle events and layering the trigger-driven items on top.
-
Connect the reserve accruals to the roadmap so pre-funding is visible.
-
Review on a fixed cadence — quarterly for triggers and rates, annually for the full roadmap.
Doing it in the wrong order leaves you with policies that don't match reality.
Where instrument and vendor data feed in
None of this works if the underlying supply and vendor picture is unstable. A chargeback rate assumes reagent prices you can predict, and a trigger that says "outsource overflow" assumes a vendor relationship that can actually absorb it on short notice. Getting the procurement foundation right — SLAs, critical spares, risk scoring — is what makes the financial layer trustworthy. Our guide on procurement and vendor governance with SLAs and risk-based scorecards covers the supplier side that sits underneath all of this.
The operational reality is that most of this data already exists across your systems — booking logs, LIMS run counts, purchase records, service tickets. The work isn't collecting it, it's connecting it into rules that fire on their own. Modern lab management platforms increasingly pull these threads together, surfacing a trigger the moment a threshold is crossed and updating the roadmap's reserve math automatically, so the quarterly review becomes a confirmation rather than a scramble through five spreadsheets. Fewer decisions made in a panic — that's the actual payoff, not fancier dashboards.
When this system makes sense — and when it doesn't
It makes sense when you're running shared instruments across multiple projects or PIs, when capital items cost more than a single year's slack, or when cost recovery matters to your continued operation. Core facilities, growing biotech labs, and hospital research units almost always fit.
It's overkill for a single-PI lab with a handful of low-cost instruments and no chargeback obligations. If your entire capital picture is a couple of pipettes and a shared centrifuge down the hall, building a five-row trigger table is process for its own sake.
Who should be careful: labs mid-migration between systems, or with genuinely unreliable utilization data. Building trigger rules on top of bad numbers just automates bad decisions. Fix the measurement layer first, then build the policy on top of it.
A realistic scenario
A university flow-cytometry core was running two instruments and losing somewhere around $30k–$40k a year despite being consistently busy. Utilization looked healthy — both units sat around 78–84% most months — so nobody could explain the deficit.
The problem was in the disconnected layers. Chargeback rates hadn't been touched in three years, so cost recovery had drifted to around 76%. There was no reserve line, so every capital conversation started from zero and got shot down. And with both instruments consistently in the trigger zone, there was no rule saying what to do about it — so nothing happened except growing frustration and a lengthening queue.
They rebuilt the model over about two quarters. Rates were reloaded with full cost plus a small reserve contribution, which pushed recovery back to roughly 97%. A trigger table made the 80%-for-three-months threshold explicit, which finally justified a second-instrument evaluation on rules rather than volume of complaints. The reserve line quietly accrued around $30k against the eventual third instrument.
The deficit closed within the year. More importantly, the next capital request went through in one meeting instead of three, because it arrived with a trigger behind it, a reserve against it, and a roadmap around it. The money question had turned boring — which was exactly the point.
Closing thought
The labs that handle budgets well aren't the ones with the most funding or the fanciest dashboards. They're the ones where a number crossing a line automatically kicks off a known response, where the price of a service reflects its real cost, and where next year's purchases were visible two years ago. Get those three layers talking to each other and capacity planning stops being an annual argument. It becomes a system that mostly runs itself — and quietly makes you look far more prepared than the lab down the hall that's still finding out about problems the hard way.
Ready to upgrade your lab operations?
Join 500+ labs using Labioly to save time, reduce errors, and enhance productivity and compliance.