

Most digital transformation efforts in labs don't fail because the technology is bad. They fail because everything gets attempted at once. A new LIMS, instrument integrations, a data governance overhaul, dashboards for the PI, barcode rollouts — all kicked off in the same fiscal year because that's when the budget got approved. Six months later, half the projects are stuck in "we need to fix the data first" limbo, bench staff have quietly gone back to their spreadsheets, and someone in leadership is asking why the money isn't showing results.
The problem is sequencing. A lab digital transformation roadmap isn't a shopping list of systems to buy. It's an order of operations. You can't optimize what isn't integrated, and you can't integrate what isn't stable. When labs skip the boring foundational work and jump straight to the impressive stuff, the impressive stuff collapses under its own weight.
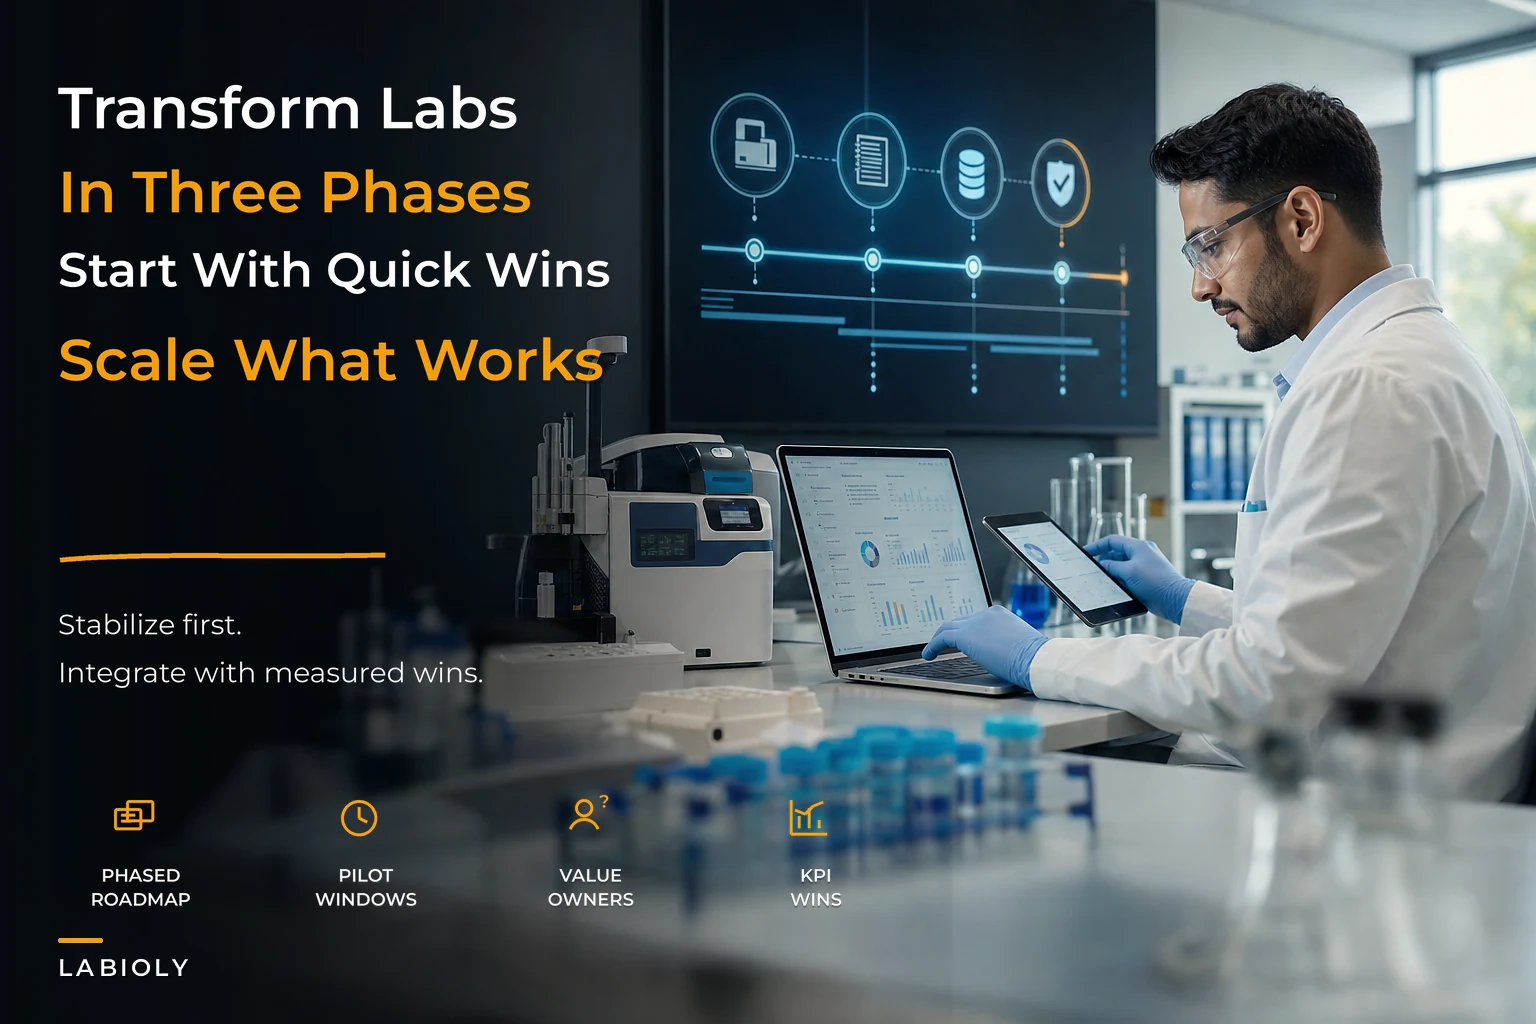
This is the case for a three-phase approach: stabilize, then integrate, then optimize. Sounds obvious, but almost nobody actually does it in that order. Below is what each phase really involves, how to decide what goes where, and how to tie the whole thing to KPIs that survive contact with an actual budget review.
The three phases, and why the order is non-negotiable
The instinct in most labs is to reverse this entirely. Leadership wants the optimization payoff — predictive reagent ordering, automated reporting, real-time capacity dashboards — because that's what got the initiative funded. So teams try to build analytics on top of data that's still living in five disconnected places, half of it entered by hand.
Here's the pattern that plays out. You build a slick capacity dashboard. It pulls from the LIMS. But instrument run data still gets typed into the LIMS manually two days later, freezer inventory lives in a shared spreadsheet, and sample states are updated inconsistently across teams. The dashboard shows numbers everyone knows are wrong, so nobody trusts it, so nobody uses it. Money spent, zero adoption.
| Phase | Core question it answers | What "done" looks like | Typical duration |
|---|---|---|---|
| Stabilize | Can we trust our current processes and data? | Consistent sample states, clean master data, reliable manual workflows, documented SOPs | 3–9 months |
| Integrate | Can systems talk to each other without human re-keying? | Instrument-to-LIMS capture, ELN/LIMS field contracts, single source of truth per data type | 6–18 months |
| Optimize | Can we now make the system faster, smarter, cheaper? | Automated reporting, forecasting, capacity planning, exception-based workflows | Ongoing, year 2+ |
The durations overlap in real life. You don't finish stabilization completely before starting integration pilots. But the center of gravity moves through these phases in order. If integration work keeps tripping over data-quality problems, that's a signal the team moved on too early.
Phase 1: Stabilize — the phase everyone wants to skip
Stabilization is unglamorous. It's cleaning up sample naming conventions, agreeing on what a "sample state" actually means across three research groups, making sure the same reagent lot isn't recorded four different ways, and getting people to actually follow the SOPs that already exist.
Eliminate lab bottlenecks and errors.
Labioly helps you monitor, manage, and report lab activities efficiently and compliantly.
- Real-time sample tracking
- Inventory and supply alerts
- Staff workflow coordination
No credit card required
This typically shows up in labs that grew organically. Each team built its own tracking habits when it was three people. Now there are twenty-five people across four groups, and "Group A's sample ready" means something completely different from "Group B's sample ready." No integration fixes that — it just automates the confusion faster.
What stabilization actually covers:
-
Master data cleanup. One canonical list of instruments, reagents, sample types, project codes. Duplicates merged. Naming conventions enforced.
-
Consistent state definitions. Everyone agrees what "received," "in-process," "on-hold," and "archived" mean, and when a sample moves between them.
-
SOP reality check. Not writing new SOPs — verifying the existing ones describe what people actually do. The gap between documented and actual process is usually where errors hide.
-
Baseline metrics. You cannot prove improvement later if you never measured the starting point. Capture turnaround times, rework rates, and sample-loss incidents now, even if the numbers are ugly.
That last one matters more than people give it credit for. If you skip baselining, every future win becomes an argument instead of a fact. When someone in finance asks whether the LIMS was worth it, "it feels faster" loses that conversation. "Median turnaround went from about 9 days to roughly 5" wins it.
The prioritization filter for Phase 1
Not every stabilization task is equal. Score each candidate on two axes: how much downstream work depends on it and how broken it currently is. Fix the things that are both foundational and painful first.
A practical example — a mid-sized translational lab had a choice between cleaning up freezer inventory records or standardizing project codes. Freezers were annoying but localized. Project codes touched every system downstream: billing, reporting, sample tracking, chargebacks. Project codes won, because getting them wrong would have poisoned every integration built later. Freezers got cleaned in a later sprint.
Phase 2: Integrate — where the actual leverage lives
Once data is trustworthy and processes are consistent, integration stops being a fight. This is where you eliminate the re-keying that quietly eats hours every week — instrument outputs flowing into the LIMS automatically, ELN entries linking to LIMS records without someone copying values by hand.
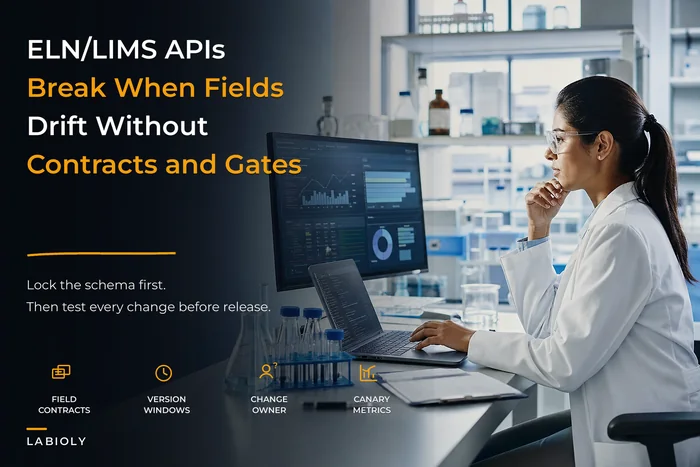
What breaks labs at this stage usually isn't the connectors themselves. It's the absence of contracts. When Team A renames a field in the ELN and it silently breaks the sync to the LIMS, you get data-quality regressions that are painful to trace. This is exactly why field-level agreements matter — the discipline covered in API governance for ELN/LIMS integrations is what keeps integrations from decaying six weeks after go-live.
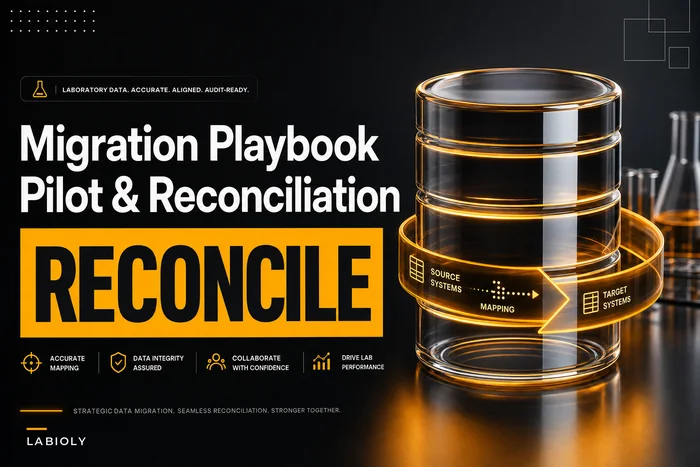
Same logic applies to system migrations. Moving to a new LIMS without canonical field-mapping and reconciliation tests is how labs lose audit history and end up with two systems, both half-populated. The staged approach in the LIMS migration playbook — pilot first, map fields deliberately, reconcile before cutover — exists because the "big bang" migration is where sample records go to die.
Minimal pilots beat big rollouts
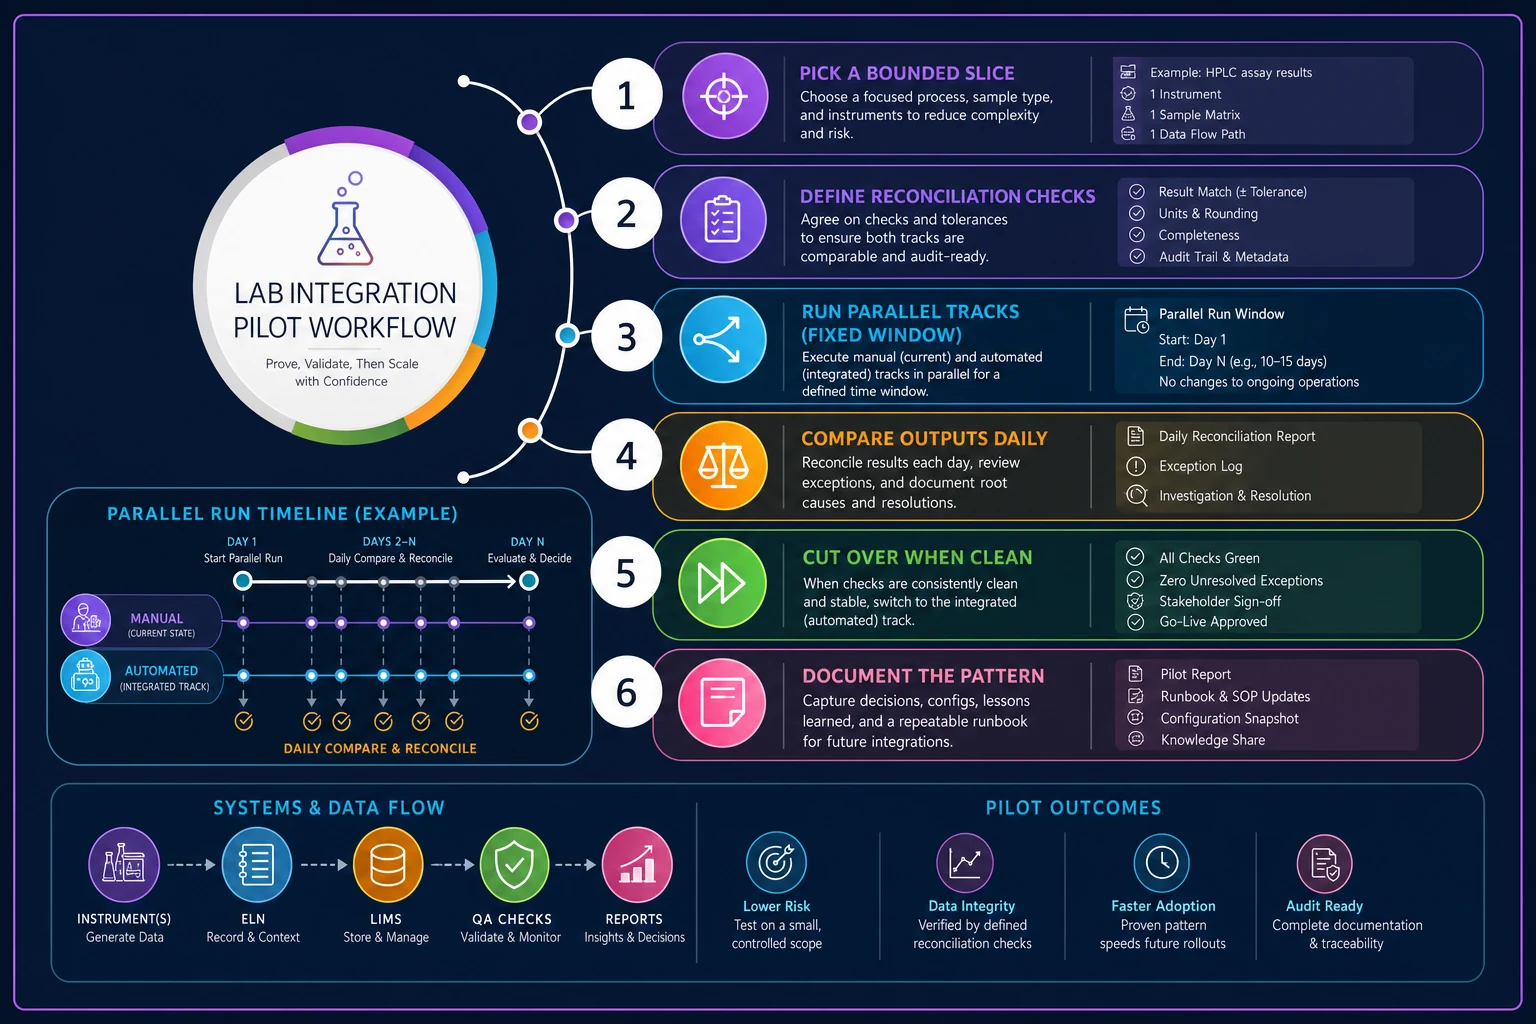
The single biggest predictor of whether integration succeeds is whether you piloted small first. A minimal pilot means picking one instrument, one workflow, or one team and integrating just that end-to-end before touching anything else.
-
Pick a bounded slice. One instrument type feeding one assay workflow. Not "all instruments."
-
Define the reconciliation check up front. How will you prove the integrated data matches the manual record? Decide before you build, not after.
-
Run parallel for a fixed window. Keep the old manual process running alongside the automated one for two to four weeks.
-
Compare outputs daily. Catch discrepancies while they're small and traceable.
-
Cut over only when reconciliation is clean. No mismatches for the agreed window, or you don't advance.
-
Document the pattern. The next integration reuses this template instead of reinventing it.
That parallel-run window feels slow. It's the cheapest insurance you'll ever buy. A discrepancy caught during parallel running costs an afternoon. The same discrepancy caught six months later, after decisions were made on bad data, costs a re-run of experiments.
create an image depicting a lab integration pilot workflow: pick a bounded slice, define reconciliation checks, run parallel manual and automated tracks for a fixed window, compare outputs daily, cut over when clean, and document the pattern; include icons for instrument, ELN, LIMS, QA checks, and a timeline showing the parallel run
When integration is a bad idea (yet)
-
If sample states still aren't consistent across teams — go back to Phase 1.
-
If nobody owns the field definitions — assign an owner first, or the integration will rot.
-
If the "source of truth" for a data type is genuinely disputed between two systems — resolve that politically before you resolve it technically.
Who should not start integration: labs where the LIMS itself isn't stably adopted. Automating data flow into a system half the staff avoid just moves the adoption problem somewhere else.
Phase 3: Optimize — the payoff, finally earned
Optimization is everything leadership wanted from day one: automated QC reporting, reagent forecasting, capacity planning, exception-based alerting instead of manual monitoring. The reason it works now and didn't before is that it's sitting on stable processes and clean, integrated data.
This is the phase where AI-assisted automation genuinely earns its keep — not as a headline, but as plumbing. Once instrument data flows in reliably and sample states are consistent, an operational platform can flag anomalies, predict reagent stockouts from actual consumption patterns, and surface capacity bottlenecks before they hit the schedule. The automation only produces trustworthy output because the two prior phases made the inputs trustworthy. Run the same tools on Phase 1 data and you get confident, automated nonsense.
A word of caution on metrics here. It's easy in the optimization phase to build beautiful dashboards measuring things that don't actually matter — utilization percentages that look great while turnaround times quietly slip. The discipline of choosing metrics that reflect real operational health — covered in depth in this breakdown of operational KPIs versus vanity metrics — is what separates an optimization phase that changes decisions from one that just generates screensavers.
Tying value to KPIs at every phase
The roadmap only survives budget scrutiny if each phase produces measurable value, not just "progress toward transformation." Here's how the metrics map across phases:
| Phase | Quick-win KPI | Longer-term KPI |
|---|---|---|
| Stabilize | Reduction in duplicate/master-data errors; SOP compliance rate | Sample-loss incidents per quarter |
| Integrate | Manual re-keying hours eliminated per week | Data-reconciliation discrepancy rate |
| Optimize | Report generation time; stockout events avoided | Turnaround time; effective capacity utilization |
Notice the quick wins in each phase are things you can show in weeks, not years. This is deliberate. Multi-year transformations lose funding in the gaps between milestones. If Phase 1 produces a visible win — "we eliminated the four-way reagent naming mess and cut a recurring source of run errors" — you buy the political room to do Phase 2.
The mistake labs make is promising the Phase 3 payoff to justify Phase 1 spending. Then Phase 1 takes nine months, produces no headline result, and the whole initiative looks like it's failing right when it's actually on track. Sequence the wins, not just the work.
A real scenario: mid-sized core facility, three-year arc
A shared core facility running around 300–350 sample submissions a month across multiple PI groups had the classic mess: three tracking spreadsheets, instrument data typed into the LIMS a day or two after runs, and constant arguments about whose samples were where. Turnaround was inconsistent — anywhere from 6 to 14 days depending on which tech handled the submission.
Year 1 (stabilize): They didn't buy anything new. They consolidated to one canonical sample-state model, cleaned up project codes, and got the existing LIMS actually adopted by all groups. Ugly baseline captured: median turnaround roughly 9 days, sample-related reruns happening a few times a month. The naming cleanup alone cut a recurring class of mislabeled-submission errors noticeably — that was the quick win that kept the initiative alive.
Year 2 (integrate): Minimal pilot on their busiest instrument, parallel-run for three weeks, reconciled clean, then cut over. Rolled the same pattern to two more instrument types. Manual re-keying dropped by something like 8–10 hours a week across the team. Turnaround tightened to around 5–6 days, mostly because data wasn't sitting for two days waiting to be entered.
Year 3 (optimize): Automated QC reporting and consumption-based reagent forecasting on top of the now-clean data. Stockout-driven delays, which used to happen most months, became rare. Reporting that used to take a tech half a day dropped to minutes.
No single heroic system fixed this. The order fixed it. Had they started in year one with the year-three tooling, the forecasting would have run on garbage and the reports would have been distrusted from day one.
Where teams get the sequencing wrong
A few recurring patterns worth watching for:
-
Buying the platform before defining the process. The tool inherits your chaos. Stabilize first.
-
Skipping the baseline. You lose every future ROI argument.
-
Treating integration as an IT project. It's an operations project with IT components. The field definitions are operational decisions.
-
Optimizing prematurely. Automation on unstable data produces confident wrong answers, which is worse than no answer.
-
Promising the endgame to fund the foundation. Sequence visible wins into every phase so momentum doesn't die between milestones.
Where teams get the sequencing wrong
Bottom line on sequencing
The reason stabilize → integrate → optimize works isn't that it's a clever framework. It's that each phase removes the exact thing that would have caused the next phase to fail. Stable processes make integration tractable. Clean, integrated data makes optimization trustworthy. Skip a step and you don't save time — you just move the failure to a more expensive point in the project.
Build the roadmap around that dependency chain, attach a genuine quick win to each phase so funding survives, and measure against operational KPIs your bench staff actually recognize as real. That's the difference between a multi-year transformation that compounds and one that quietly gets shelved in month eight.
Build the roadmap around that dependency chain, attach a genuine quick win to each phase so funding survives, and measure against operational KPIs your bench staff actually recognize as real. That's the difference between a multi-year transformation that compounds and one that quietly gets shelved in month eight.
Ready to upgrade your lab operations?
Join 500+ labs using Labioly to save time, reduce errors, and enhance productivity and compliance.